


How to Avoid Ditching a Winning Strategy at the Wrong Time
Using historical Max DD % as an indicator

Have you ever abandoned a trading strategy just before it started working?
When we start trading a new strategy, we often lack confidence in it, especially if it begins with a losing streak.
But how do we know if we should stop trading it or if it’s about to make us money in the long term?
Let me share a data-driven way to answer that question.
The Mall Guard Turned Multimillionaire
Kristjan Kullamägi, a Swedish mall guard, earned $79,046,000 trading momentum between 2013 and 2021.
How do I know? Tax records in Sweden are public, and his figures are available online.
In 2021, I saw his earnings and decided to uncover his secret.
Luckily, Kristjan had a blog detailing his three strategies.
Thrilled to have discovered the holy grail, I started following them in 2022.

Then the Losses Began
The problem must be me.
If I’m losing money with the world’s best trader’s strategies, I must be doing something wrong.
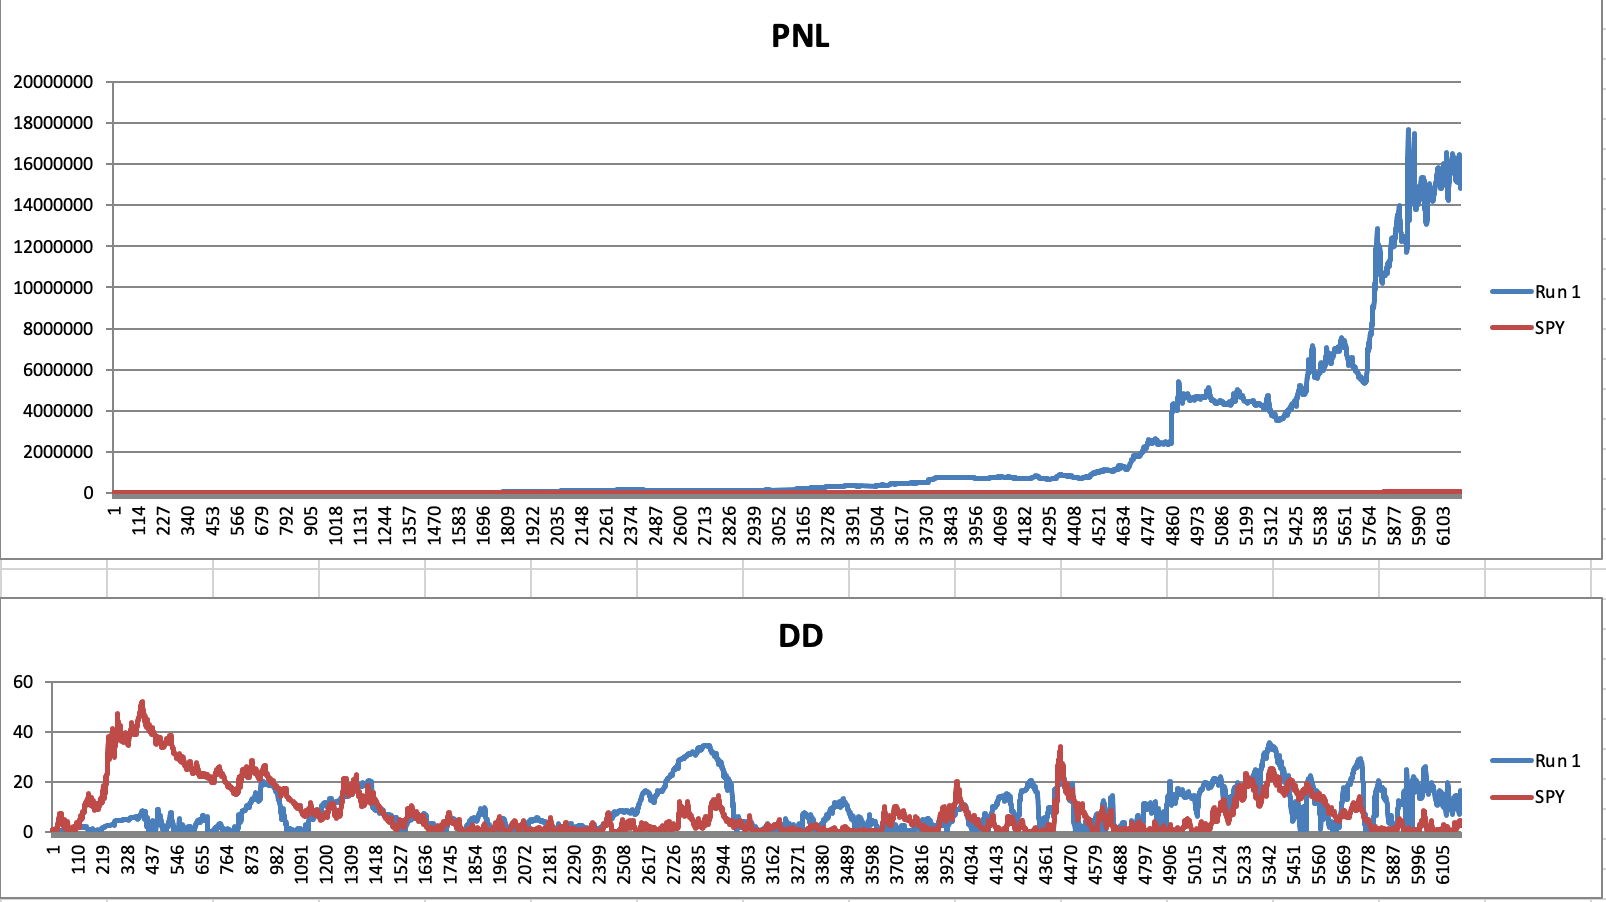
Loss after loss, and the drawdown (the percentage drop from the peak of the PNL curve to its local trough) deepened.
When I hit a 20% account drawdown, I quit. There was no way I’d keep losing money on these strategies.
By the end of 2022, Kristjan’s new tax returns were out: minus $25,600,000 (!) with a 32% drawdown.
Wait—was it okay that I lost money? And how much is “okay” to lose? 30%? 50%?
I built a program to analyze historical performance data of trading strategies.
I ran the version of Kristjan’s strategy that I tried and discovered that historically, it had endured drawdowns as deep as 35%.
So my 20% was totally acceptable.

The Strategy Takes Off Without Me
As soon as I stopped trading the strategy, it started working.
2023 was stellar for the strategy.
It turned out that 2022 was a losing year, but the losses were normal and had happened before with this strategy.
The key is understanding how much a strategy can lose based on the sizes you trade and its historical equity curve.
As long as the losses stay within range, there’s no reason to stop trading.
And if you know the maximum historical drawdown, you should only trade the strategy when you’re 100% comfortable with that potential loss.
Imagine how you’d feel with such a loss.
Can you handle it financially and emotionally?
A strategy is “broken” only when the drawdown exceeds its historical maximum.
Even then, you should allow some buffer for deeper declines, as the strategy’s future is usually more volatile than the past (for reasons beyond the scope of this post).
Know the Past, Plan the Future
Here are some ways to avoid abandoning a working strategy at the worst possible time:
Own Your Strategy: Understand its historical performance and potential. What’s a reasonable future profit? What’s a reasonable maximum drawdown?
Set Limits Beyond Historical Max: Give yourself a buffer. For instance, 1.5 × 20% = 30%. If the strategy loses more than 30% in live trading, stop and reassess.
Start During a Drawdown: Begin trading the strategy when it’s already in a drawdown. Cycles often work in your favor, and chances are it will recover from there.
Scale In Gradually: Instead of going all in, allocate funds to the strategy in stages until you reach the full amount you plan to invest. This is like Dollar Cost Averaging (DCA) but for a trading strategy.
Recognize When a Strategy Breaks: If a strategy loses significantly more than its past performance suggests, it’s likely stopped working. That’s the time to part ways and find a new one.
Great article, but for curiosity, ...(lol) what was the strategy?
one more thing that i identified with my crappy record was that stock selection matters.. to be in the MOMO leaders and not random pops...super hard to decipher but easy in hindsight