
Massive Problems (Part 3)
How I deal with Late Prints

Edit: I switched to cleaning late prints by rebuilding pre-market data from trade data, but only for backtested trades that executed pre-market. I then cache that data for reuse. This gives accurate backtests without wasting time aggregating intraday data. It’s a lot more accurate than normalizing late prints with math.
If you followed Part 1 and 2, late prints are the last hurdle to a (somewhat) reliable Polygon backtest.
Late prints are sudden intraday spikes caused by delayed reporting of large trades, dark pool activity, or block trades.
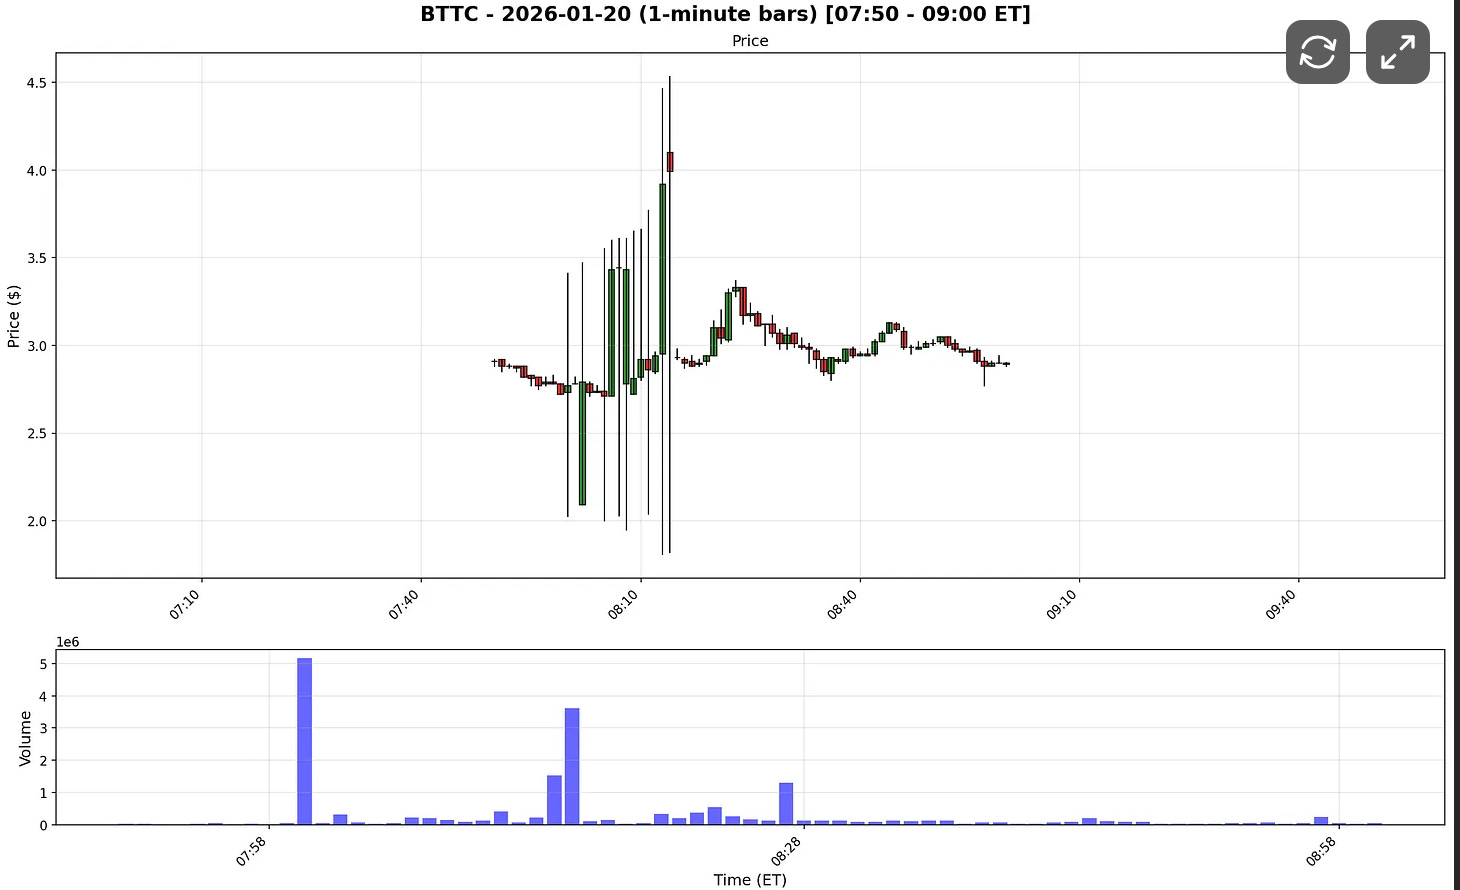
The easiest way to see their impact is to compare charts with and without late prints.
Here’s the flatfile data I pulled for BTTC on 2026-01-20:
And here’s the same chart pulled using the REST API:
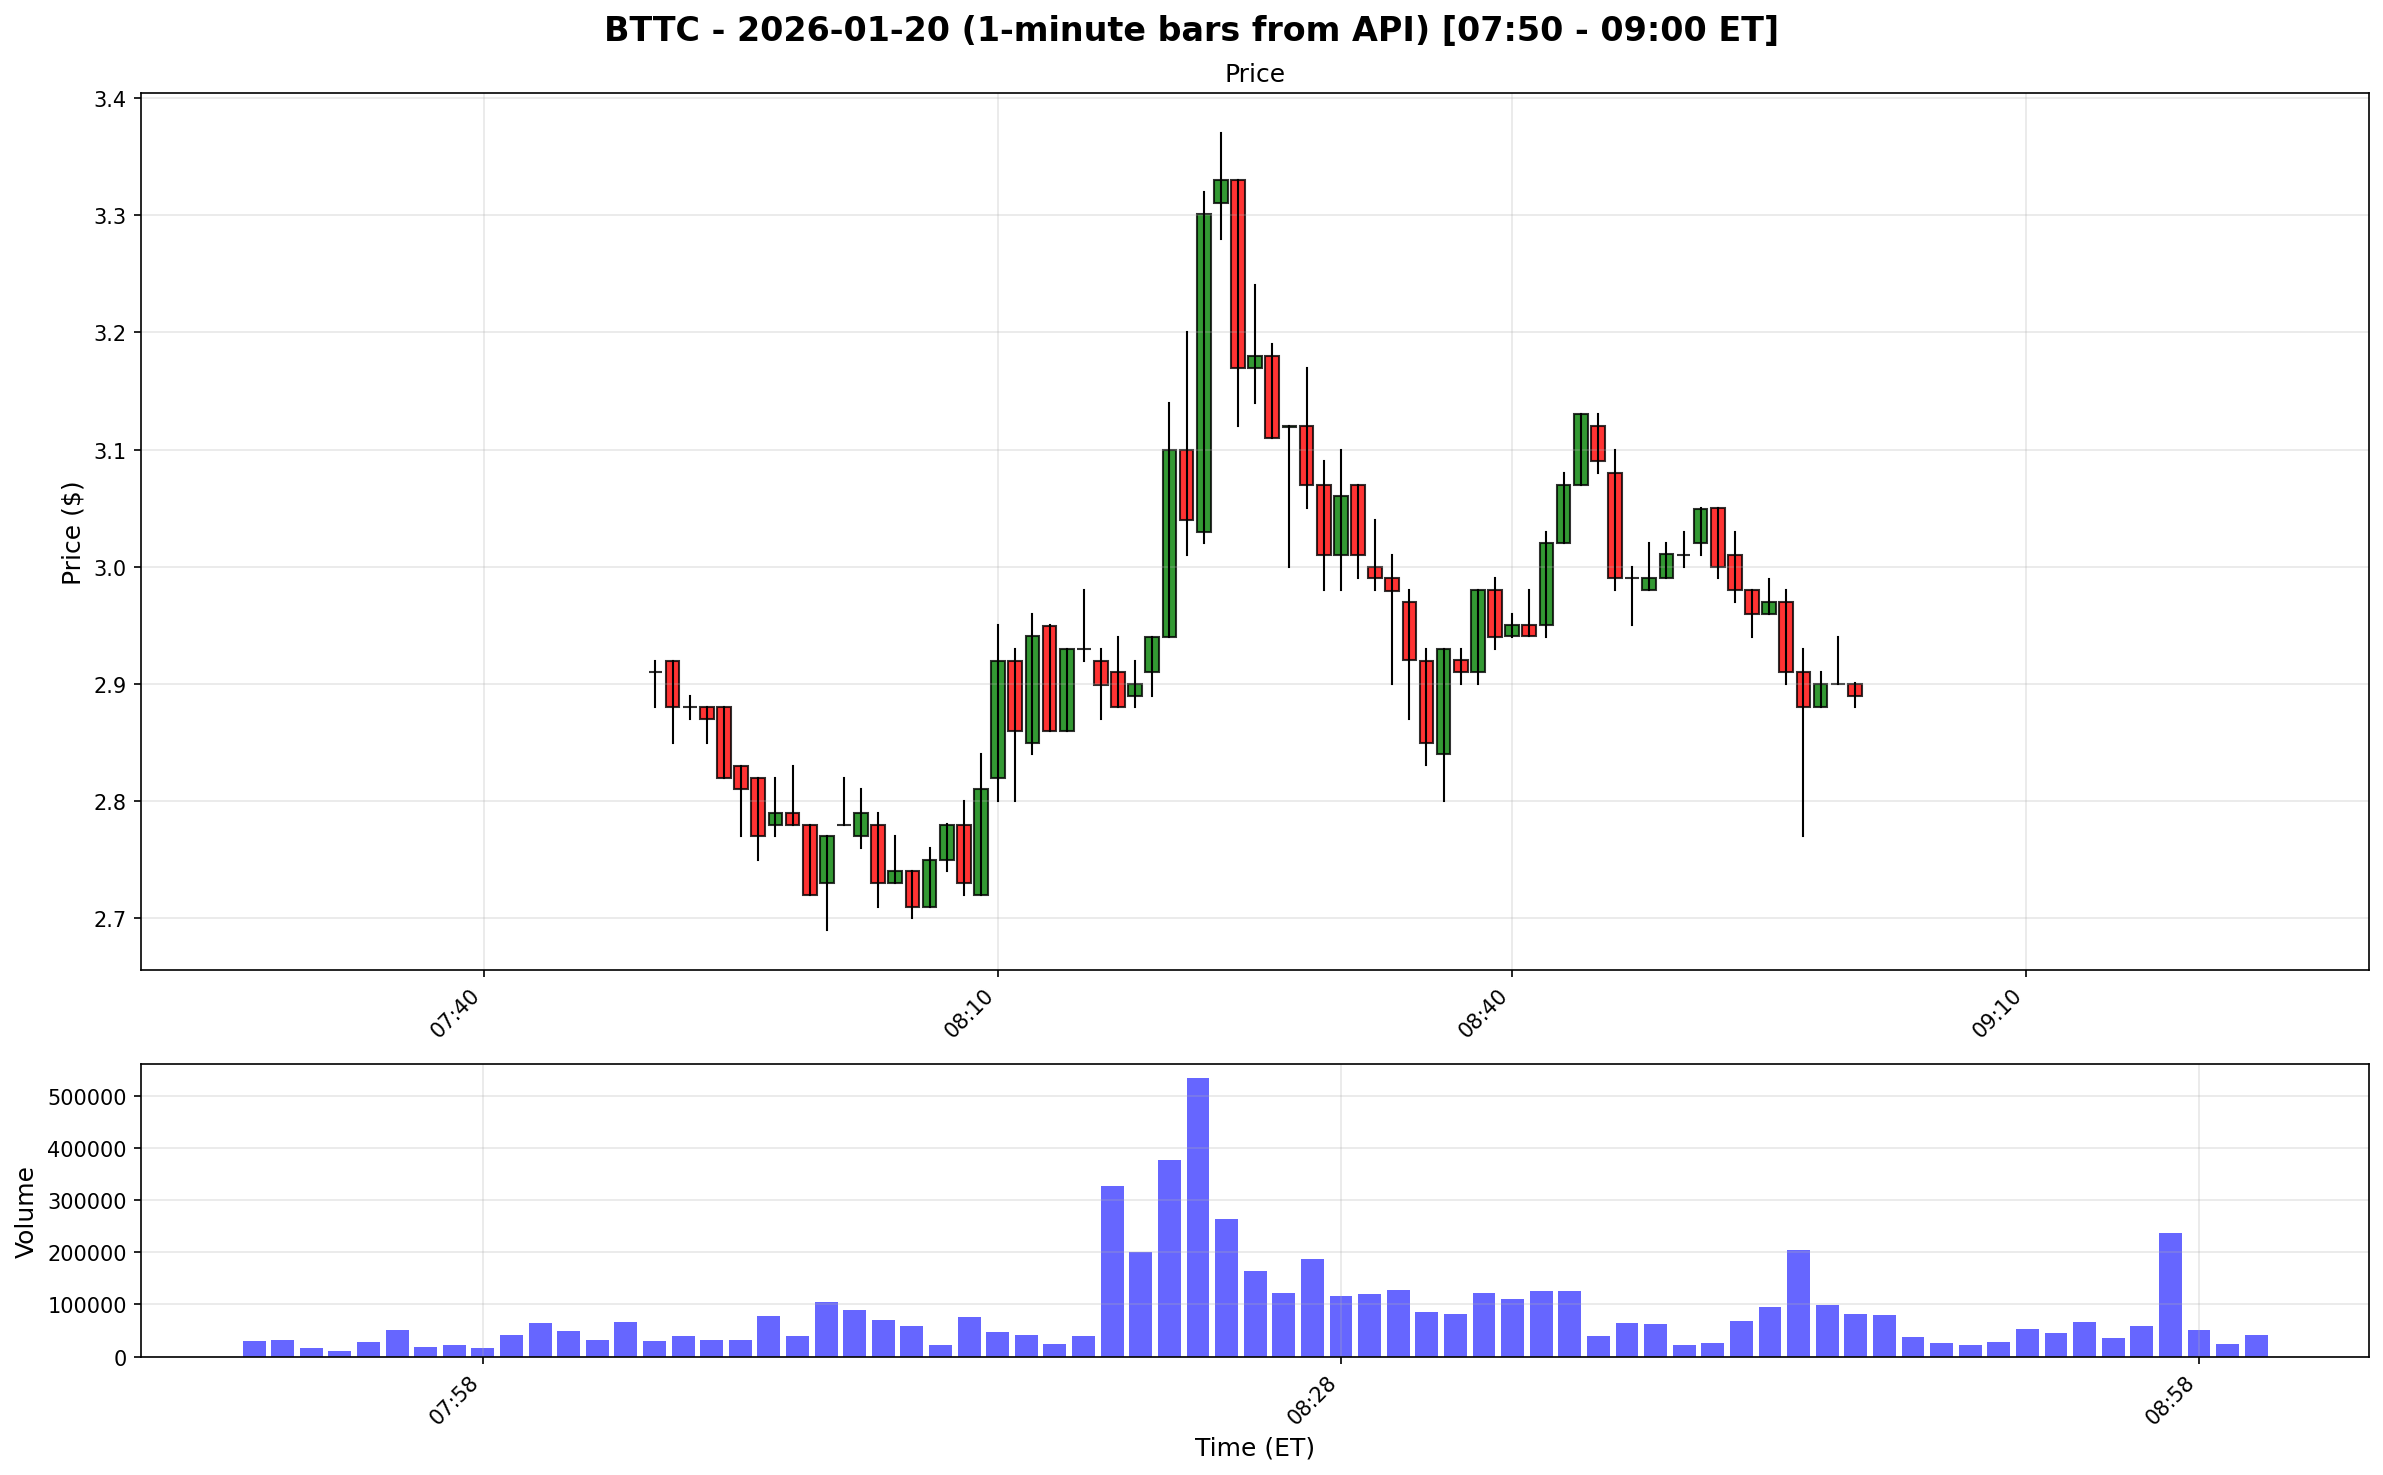
Polygon includes late prints in flat files, while the REST API mostly filters them out.
So why not just use REST 1-minute data?
Because it’s dramatically slower than downloading flat files.
Instead, I built a method to smooth late prints during premarket.
It’s a compromise, but a workable one.
Step 1: Measure how big each candle is
range = high - low
This measures how much the price moved during that candle
Big range = big movement
Small range = calm candle
Step 2: Compare each candle to recent candles
I compare each to recent candles (60 candles) on both sides of the candle (+-30).
Step 3: Find what “normal size” candles look like
This happens in two passes.
Pass 1 — Find normal size safely:
Instead of using average right away (which can be ruined by crazy candles), I use the median (the middle value). Then I measure how far candles usually sit from that median.
This gives a stable idea of what normal looks like.
Pass 2 — Remove crazy candles and measure again:
Temporarily ignore candles that look extreme
Recalculate average and standard deviation
Why?
Because crazy candles can distort statistics.This step makes the “normal” measurement cleaner.
Step 4 — Give each candle a weirdness score
Now I ask for each candle:
How far is this candle from normal?
That is done using a z-score.
Step 5 — Convert that into an easy score
Now I convert it into a simple scale:
0 = Totally normal
1 = Pretty large
2 = Very large
8+ = Extremely insane
Step 6 — Mark anomalies
If score is above 8 The candle is flagged as suspicious or abnormal.
If a candle is flagged during the time when bad data usually appears (7:00-9:00 AM), I replace it with an average of normal candles around it.
Here is how BTTC looks like after normalization:
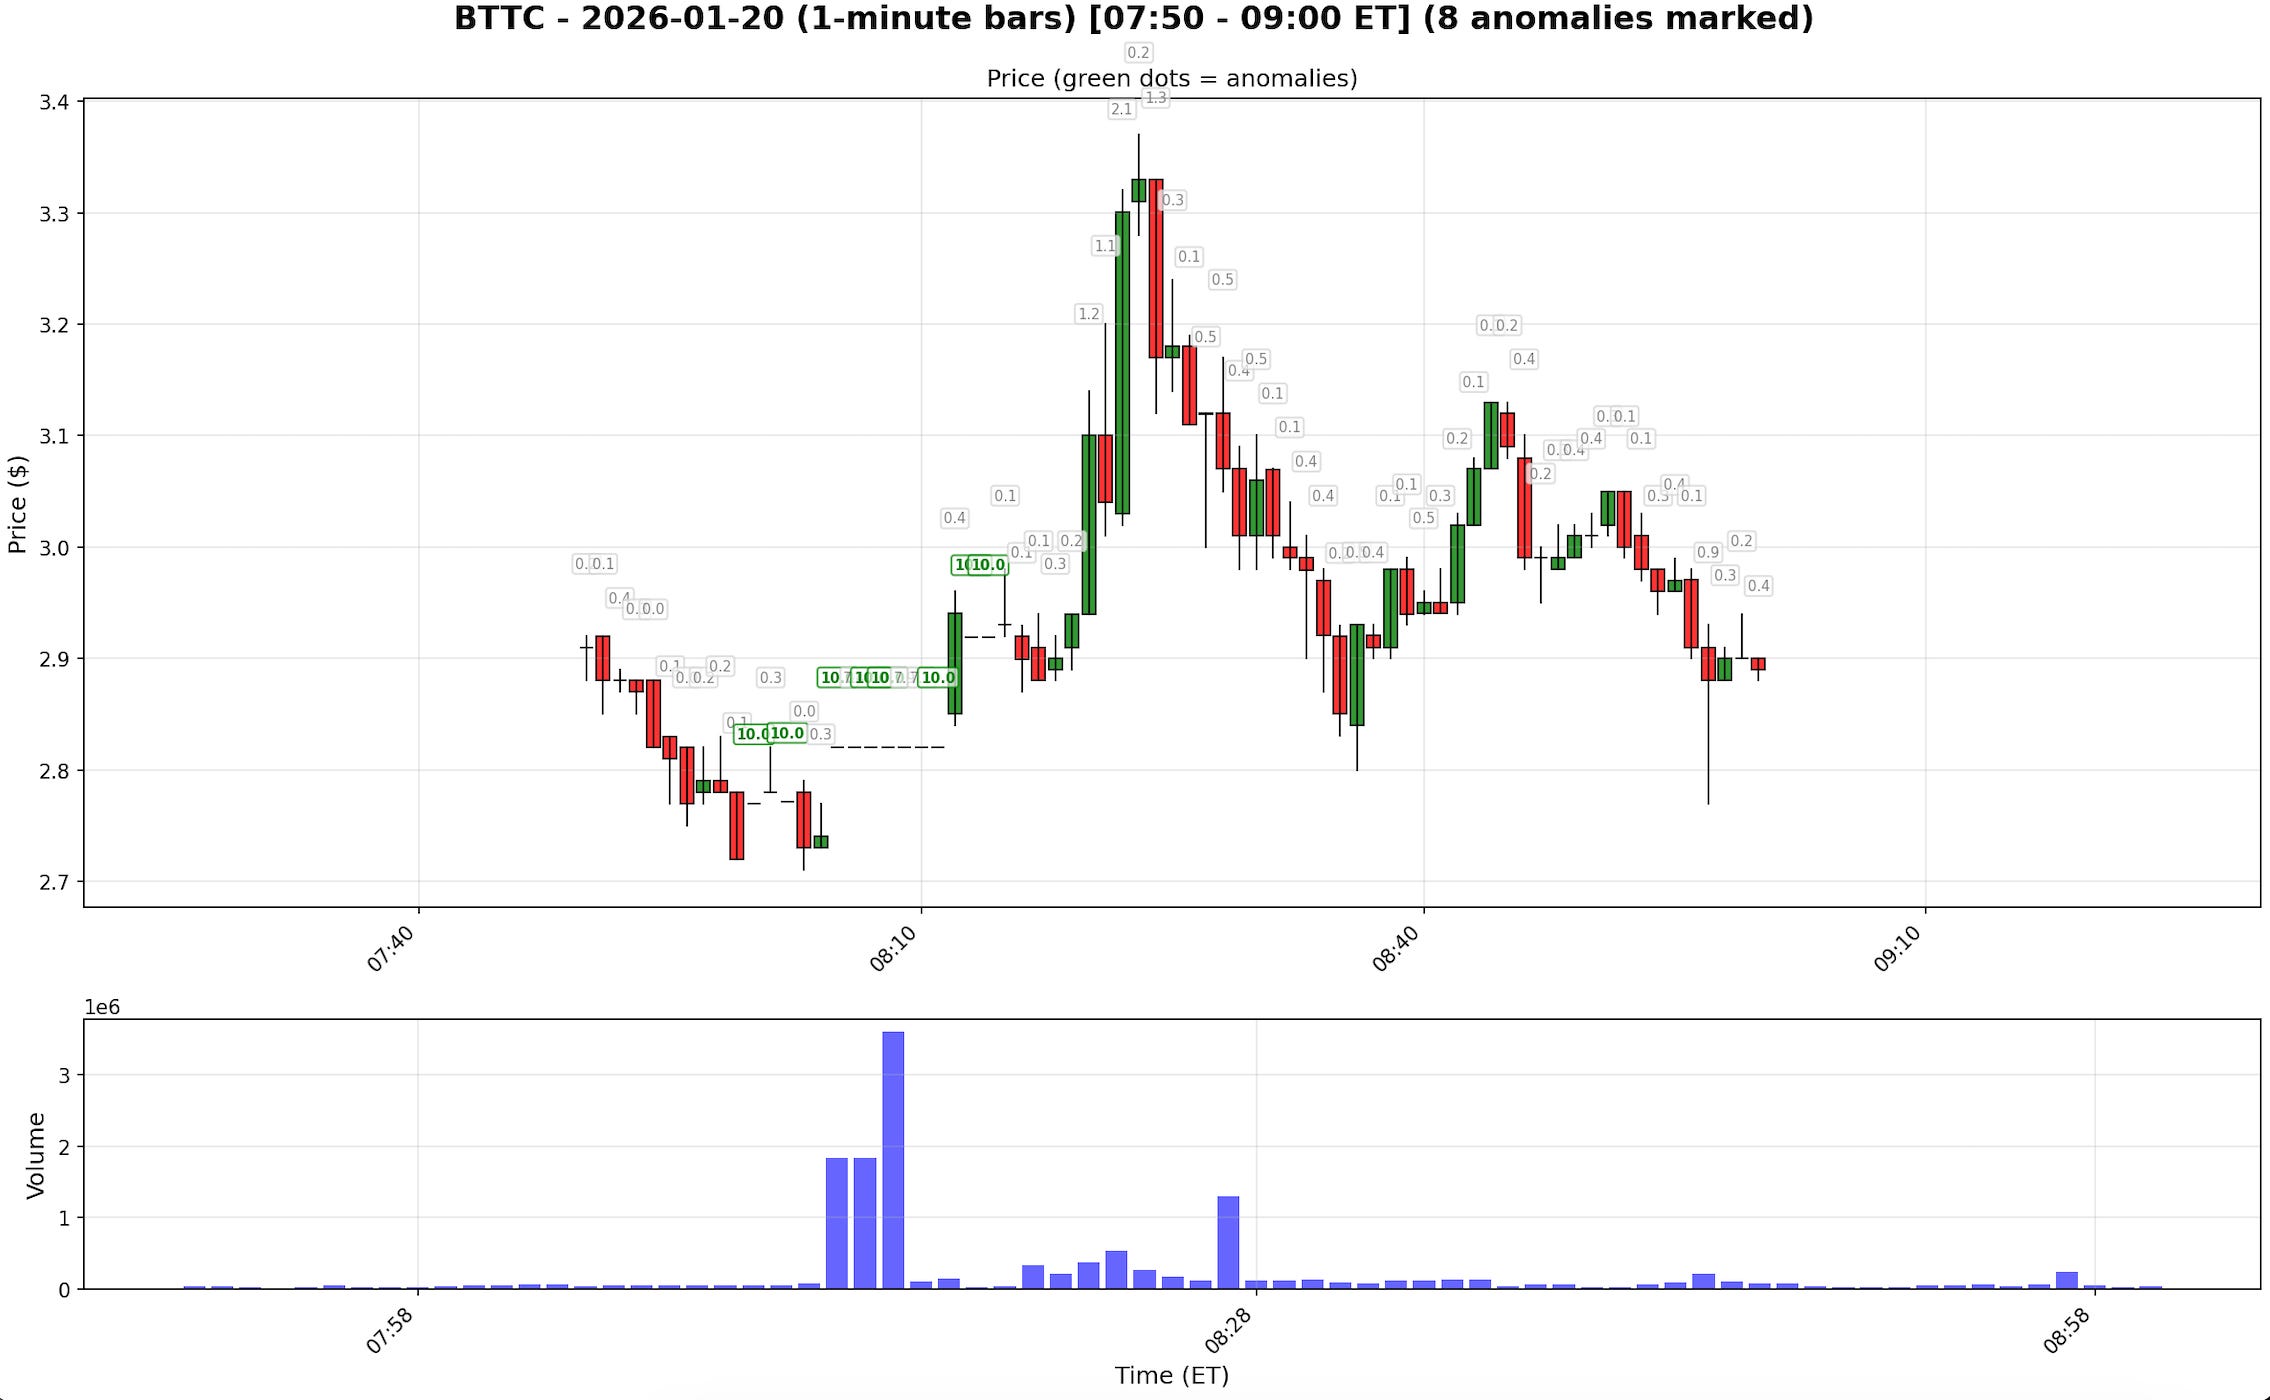
Green scores mark the extreme candles that were normalized. Grey candles are those the system considers clean.
But I Don’t just normalize everything
It has a cost. You trade accuracy and speed for cleaner data.
To increase speed, I first run the backtest on all data. Then, only for stocks that generate entries between 7:00–9:00 AM, I normalize the charts and rerun the test.
The result is a pragmatic solution that preserves processing speed while eliminating the most disruptive data artifacts, giving you cleaner backtests without the overhead of processing every symbol through the normalization pipeline.