

2017.
I was in college.
I made my first real profit trading— around $10K on OWCP, a cannabis stock riding the theme.
A perfect breakout, straight from Cameron Fous’ course I learned from a bit earlier.

OWCP, an Israeli medical marijuana company, had skyrocketed after heavy promotion by Jeffrey O. Friedland, who secretly held millions of shares while hyping the stock. I didn’t know that at the time—I just heard about the stock, saw a breakout and took the trade.
For a moment, I thought I had breakout trading figured out. But every breakout trade after that? Losses. I kept trying, but every breakout I bought seemed doomed to fail.
A few years later, I found Kullamägi. Finally someone with proven track record I can learn from. I tried breakouts again—this time, a proven method backed by a successful trader.
And I crashed. 20% drawdown. Frustrated, I quit breakouts and moved to focus on other strategies.
I told myself breakout trading weren’t for me.
But recently, I went back to Kullamägi’s blog. And this time, instead of blindly following, I’m building a rules based system.
A system that defines exactly what a breakout is, along with universe selection and position sizing.
Momentum breakouts were much harder to systemize compared to the parabolic short from the previous post.
Let’s dive in...
The blog post that inspired the system
Here are Kullamägi’s recommendations from the blog post:
Breakout Trading Rules
1. Finding Breakout Setups
Scan for stocks in the top 1-2% performers over these timeframes:
1-month
3-month
6-month
Look for stocks that made a 30-100%+ move in the past 1-3 months.
Identify orderly pullbacks with:
Higher lows
Tightening consolidation range
Price surfing the 10-day and 20-day moving averages, sometimes the 50-day MA.
The consolidation phase should last 2 weeks to 2 months.
2. Entry Rules
Enter on breakout of consolidation.
Use one of these entry signals:
Opening range high (first 1-minute, 5-minute, or 60-minute candle).
Daily chart breakout (no intraday confirmation needed).
Avoid anticipating breakouts as they require more skill.
3. Stop-Loss Rules
Stop is at lows of the day.
Stop must not exceed the stock’s ATR (Average True Range) or ADR (Average Daily Range):
If ADR = 5%, max stop = 5%.
If ATR = $0.50, max stop = $0.50.
4. Profit-Taking Rules
Sell 1/3 to 1/2 of the position after 3-5 days.
Move the stop-loss to breakeven after partial profit.
Trail the rest of the position using the:
10-day MA for fast-moving stocks.
20-day MA for slower stocks.
Exit when stock closes below the trailing MA.
5. Market Conditions & Variations
Works best in a bullish market.
Can generate 10-20x risk/reward if executed well.
This pattern works across multiple timeframes:
Daily (Swing trading)
Weekly (Long-term trends)
Intraday (1-minute, 5-minute charts) – Also known as the "Holy Grail" setup.
Common chart patterns:
Flat channels
Symmetrical & descending triangles
So I had 2 major challenges here. First one was to define the breakout pattern itself in a systematic manner. The second was to create the momentum universe from which I can select stocks that breaks out.
How to define a breakout systematically?
I chose to focus on two things where I found a clear edge in the data:
Tightening consolidation range
Price surfing the 10-day and 20-day moving averages, sometimes the 50-day MA
I achieved this by 1.measuring the normalized distance from the current price to the moving averages and 2.the distance between the different moving averages (10 & 20 MA).
I wanted the price to be very tight before finally escaping the range. Once the price breaks out of that range, the algo buys.

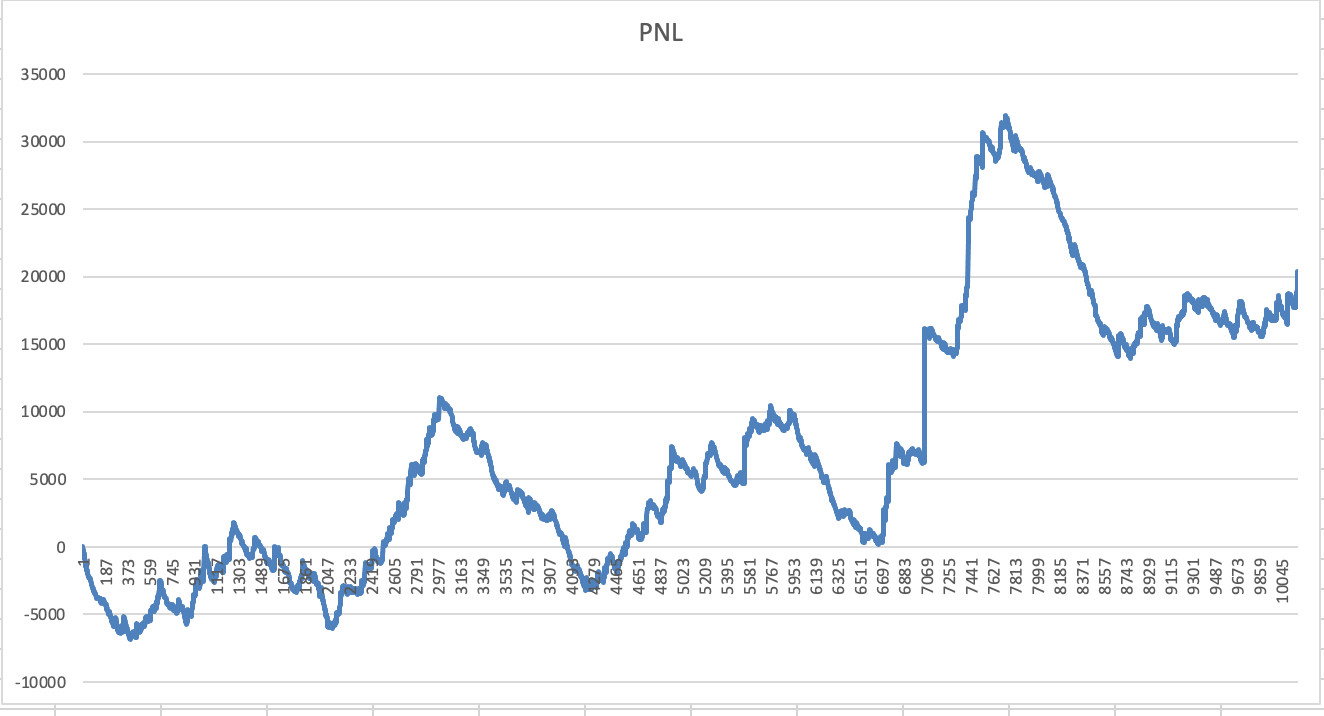
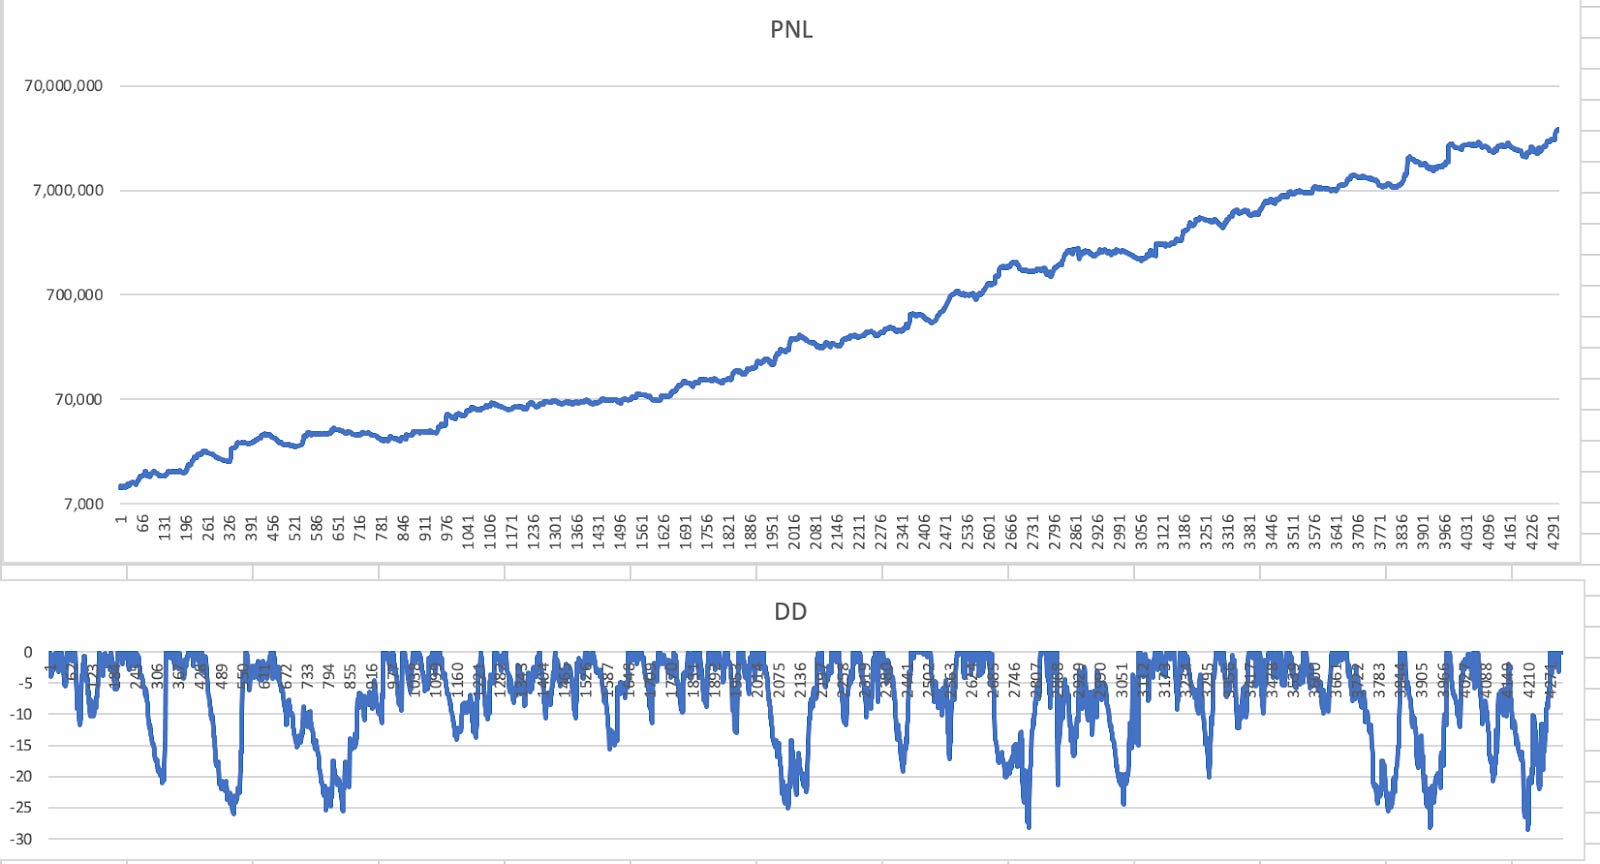
Here’s what would have happened if I had bought ANY breakout—without requiring the stock to be a top performer—between 2008 and 2025:
The Momentum Universe
The goal here is to only buy breakouts on high ADR stocks in the highest quartile of top performers. This can be based on 1, 3, or 6-month top performers (measured by Rate of Change %). I also added a 12-month period, as I’ve seen many research studies indicating that this timeframe is a good choice for momentum trading.
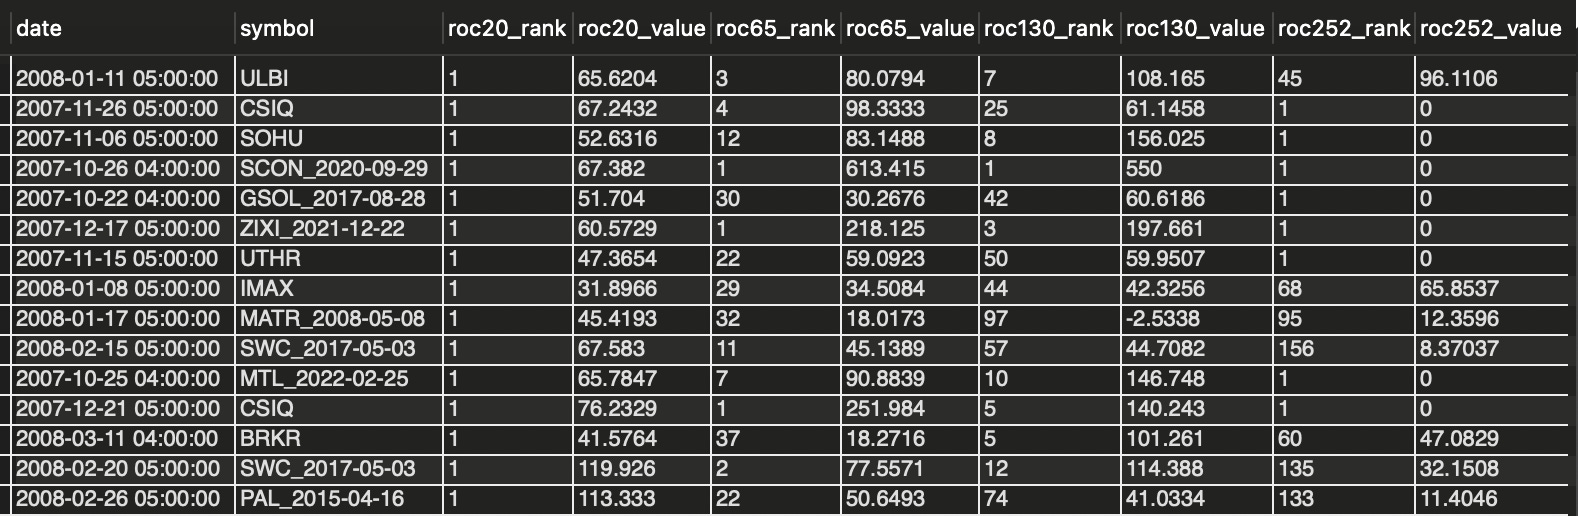
So, I created a script that runs through my database and generates a list of the top 100 stocks by performance for each day, across all the above periods.
For each stock and date, I now know its rank against the rest of the stocks and its performance for each period. This is how it looks in the database:
Then, for each stock that breaks out, I check:
That it was a top performer at the time of the breakout AND
That it is up +30% over the relevant period, depending on the length of the period.
Entry & Exit
The entry occurs at the breakout of the consolidation. This can be a break above recent highs or a gap up above them.
For the exit, I used an initial stop loss that was wider than the 1 ATR recommendation (since it didn’t perform well). I also applied a moving average trailing stop, as exiting after three days did not perform well in the backtest.
I also added a simple regime filter to know if the market is bullish or bearish. I buy a breakout only when SPY 0.00%↑ > 140 EMA.
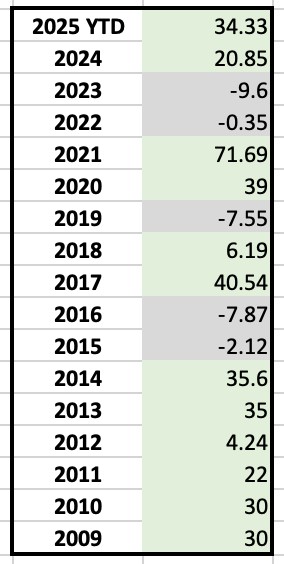
The results
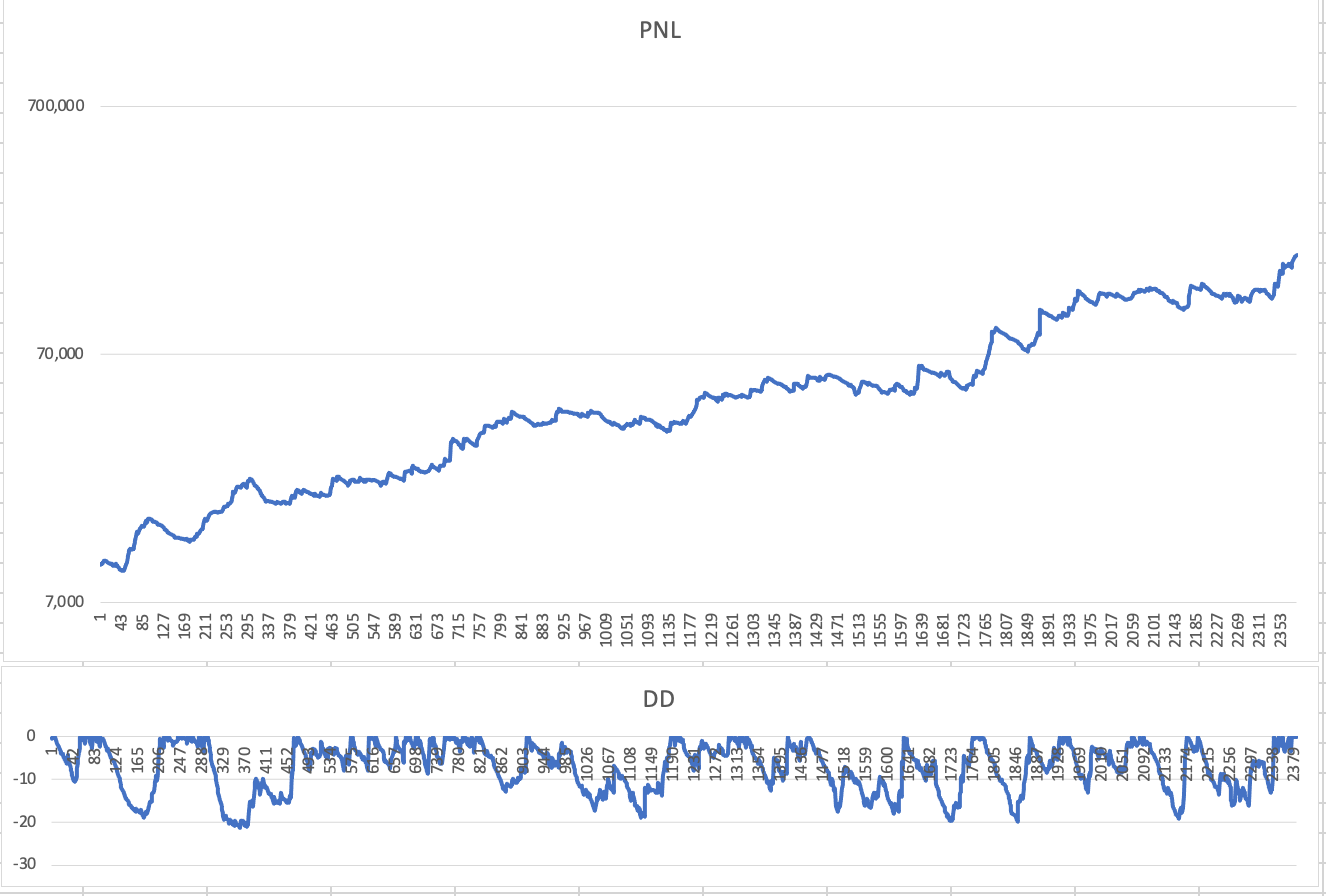
CAGR: 19%
Max DD %: -21%
Number of trades since the end of 2007: 2382
Next week, I will share the Episodic Pivot strategy using earnings announcements.
Finally, I will combine Parabolic Shorts, Momentum Breakouts, and Episodic Pivots to achieve a cool 64% CAGR.
P.S. If you want to check whether one of your breakout trades from recent years is included in the backtest, just reply to the email, and I’ll send you the details.
Love the effort that you have put into it! Great job!
One question about the SOUN trade: Your system bought on Nov 7th. Why did it not buy already on Oct 28th? Conditions look similar
Nice work Niv ! 2025, 35% 2 months in ? Might be setting up for an epic year, maybe even the best compared to the backtested results.