

In the 1960s, investors had a problem.
The common belief at the time was that financial reports couldn't be trusted to predict a company's future performance.
After all, there are countless ways to present the same data.
It’s too easy to manipulate the numbers.
So if all the financials are cooked, why even bother reading the reports?
As young accounting students at the University of Chicago, this question nagged at Ray Ball and Philip Brown.
But unlike previous researchers who had tried and failed, they were in the right place at the right time.
Their university provided them with access to a vast database of historical stock prices and fundamental financial data.
And just as importantly, they had something previous researchers didn’t — a massive university computer that was so large it occupied two entire rooms.
With this computing power at their disposal, they were able to analyze the data.
After rigorous work, they proved a direct link between financial reports and a company’s stock performance in the months following the earnings release.
This phenomenon became known as Post-Earnings Announcement Drift (PEAD).

How Kullamägi Turned a Boring Accounting Research into Millions of Dollars
When a stock gets unexpected good news — especially if it was previously overlooked — it can spark a strong move that lasts for months or even years.
There are many types of Episodic Pivot (EP) events, including:
earnings reports
government regulations
biotech news
and macroeconomic changes
Kullamägi focused on earnings and guidance surprises.
When a company reports much better-than-expected earnings and future outlook, it often triggers a sustained rally.
In his blog post, he shared his trading rules for capitalizing on EP:
Setup Identification
Gap Up: Stock is up 10%+ in pre-market or after-hours.
Catalyst: Ideally earnings/news with:
Strong revenue & earnings growth (mid/high double-digit or triple-digit %).
A big earnings beat (or strong numbers, even if no analyst coverage).
No Recent Rally: The stock shouldn’t have already made a big multi-month run-up.
The features I wanted to test are:
Gap %
Recent rally - measured by Rate of Change % (ROC%) of recent 30 days.
EPS change Q/Q.
EPS Surprise.
I got OHLC data from Polygon, earnings data from FMP.
So I ran a backtest that buy ALL stocks on their earnings announcement day, selling on a 20 SMA trailing stop:

50k instances,0 edge.
Let’s try adding the suggestions from Kullamägi’s post..
Improving the Raw Signal with Features Analysis
The way I like to visually see the connection between the different features and their affect on PNL, is by sorting according to a feature I would like to test.
Gap %

You can clearly see that the higher the gap the better the PNL curve look.
Kullamägi set his threshold at 10%, but I think it can be lower.
ROC % 30 Days
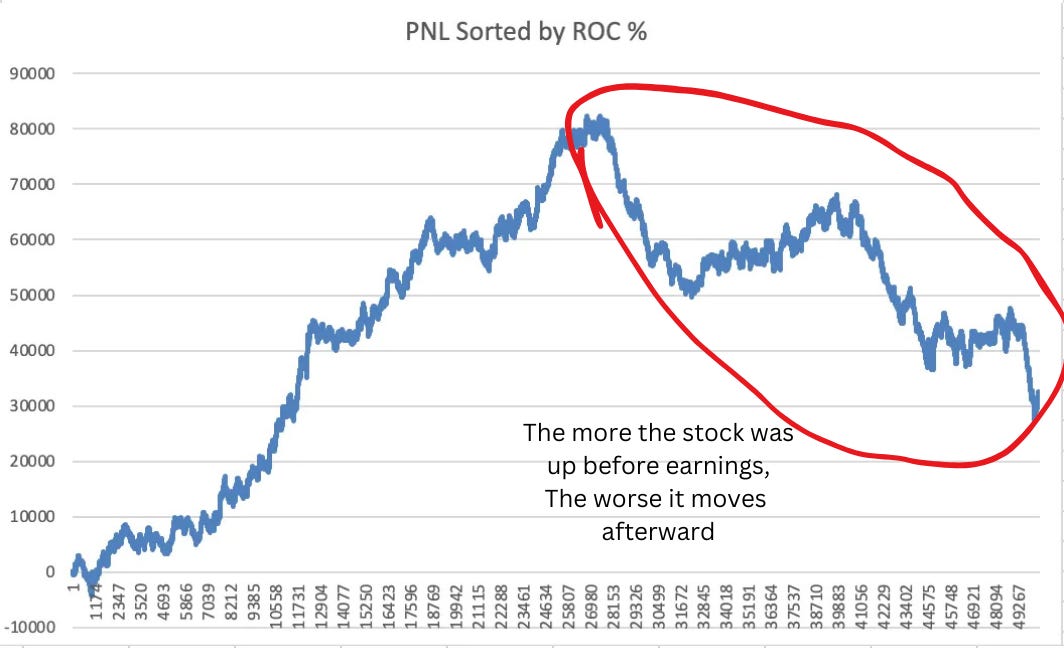
Kullamägi’s intuition here was correct as well. The less the stock went up before the earnings announcement, the better it reacts to the news.
So “neglected” stocks are better performing.
EPS change Q/Q

The higher the EPS change from last quarter - the better.
EPS Surprise

Again - the bigger the surprise, the better.
Surprise, surprise 😜
So seems like a combination of:
Gap up on the announcement day
Neglected stock
High EPS change
High surprise
Kullamägi’s suggestions can improve the raw signal dramatically.
Here are the results focusing on the above features:

CAGR: 30%
Max DD %: -29%
Number of trades since the end of 2007: 1878
Putting it All Together
When I started this series, my goal was to create a black-and-white system I could follow, inspired by Kullamägi.
Of course, expecting to duplicate his results with a rules-based system would be unrealistic, but I believe I did a great job creating a solid template. This framework allows me to test his techniques and confirm that they generate outsized returns.
First, I demonstrated that his parabolic shorts setup works well, achieving a 27.7% CAGR with a -20.9% maximum drawdown.
Then, I systemized an approach to identifying momentum breakouts, establishing rules for generating the momentum universe and defining the breakout pattern.
Next, I systemized EP, focusing specifically on earnings breakouts based on EPS change, surprise, and ROC 30.
By combining these three methods, I’m achieving the following results:

CAGR: 64%
Max DD %: -30%
Number of trades since the end of 2007: 5748
Next Steps:
The results are impressive for a fully systematic approach. Hopefully, I’ll be able to implement it in a live account soon and achieve similar results.
Additionally, during my research, I came across a study that combines the PEAD phenomenon with the Value-Glamour Anomaly.
I plan to test a similar approach by integrating my EP system with a value proxy, such as P/S or P/E. I’ll share updates here as I progress.
P.S as always - feel free to ask questions in a reply email.
Nice, I have a question ,what is the basket of stocks are you using for backtest, it is the whole US stock market (excluding OTCs ) ? Or it's just S&P ? And if it's S&P I suppose it doesn't have survivorship bias
Again, great effort Niv. What I find most difficult in trading EPs is position sizing with the high volatility in the first hour. Did you test different entry points and stop loss percentages?