
Sizing Problems : the $9k Lesson on JNVR
How to use Volatility Targeting to reduce risk

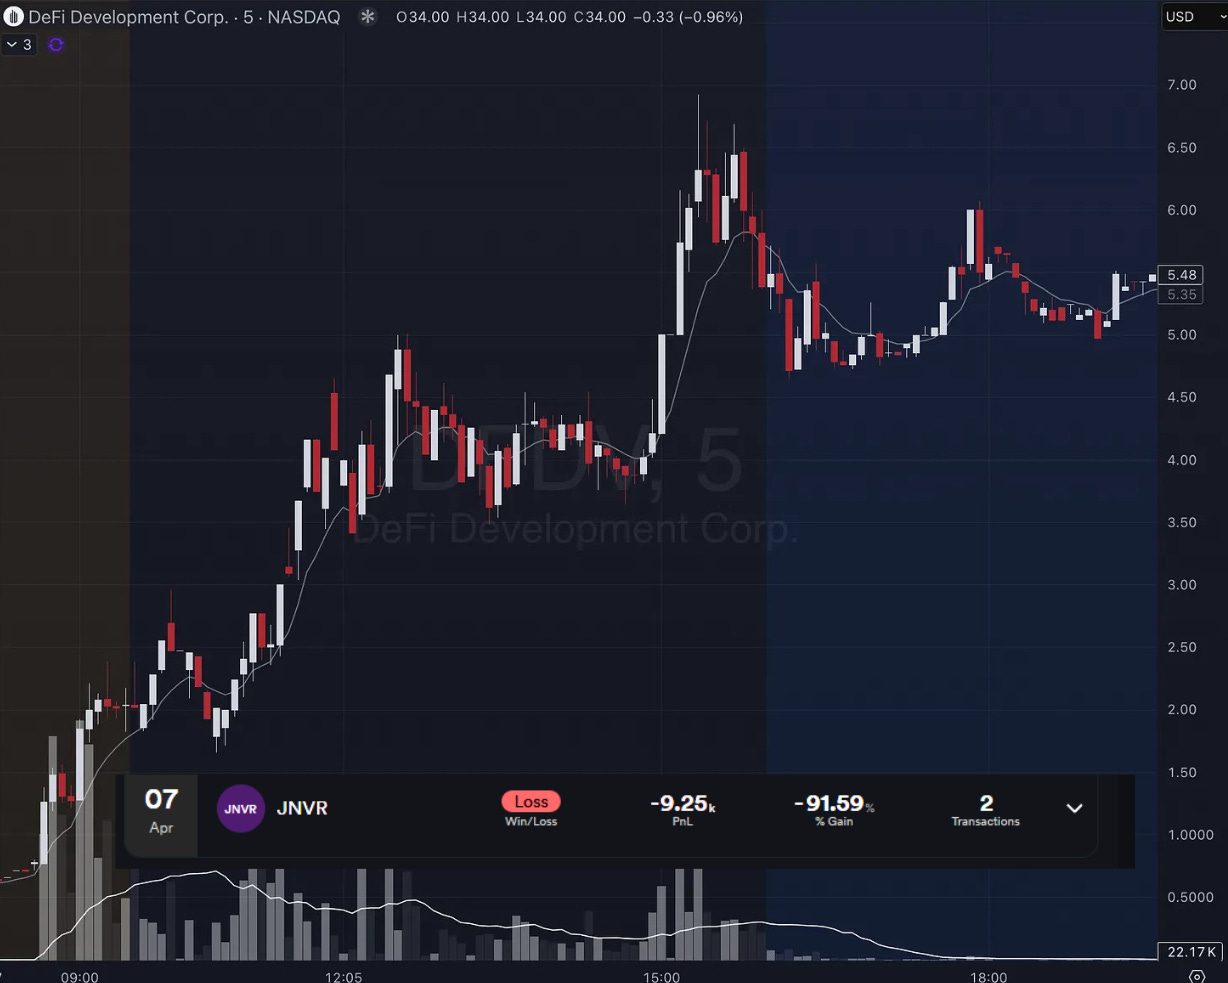
On April 7th, I took a $9,250 hit on a JNVR short (now DFDV).
That one trade wiped out around two months of gains. And it wasn’t because of the setup—I’ve shorted tickers like JNVR dozens of times before. The problem was my sizing.
I always take a 5% position size (or at least, I used to), regardless of how wide my stop loss is. That might sound disciplined on the surface, but it’s a trap. In this case, my stop was extremely wide, and I didn’t adjust my size to reflect that. I was essentially betting the same amount of capital on a 2R setup and a 0.1R setup.
For most of the year, I got away with it because there wasn’t much variation in my stop losses. But as volatility increased—especially with names like JNVR—my stop losses started to get out of hand. And with them, so did my risk.
Two Shorts, Same Size, Wildly Different Risk
Let’s see an example. Imagine two short trades, both with a 5% position size relative to a $100,000 account.
Trade A
Ticker: SCAM1
Entry Price: $10
Stop Price: $12
Risk per Share: $2
Stop Distance: 20%
Position Size (5% of equity): $5,000
Number of Shares: 500
Total Risk: 500 shares × $2 = $1,000
Clean, logical, controlled.
Now compare that to this:
Trade B
Ticker: SCAM2
Entry Price: $1
Stop Price: $3
Risk per Share: $2
Stop Distance: 200%
Position Size (5% of equity): $5,000
Number of Shares: 5,000
Total Risk: 5,000 shares × $2 = $10,000
Same 5% position, but one trade risks $1,000, and the other risks $10,000. This was the hidden ticking time bomb in my trading.
I was acting like both were equal-risk plays. But they didn’t.
A bit embarrassing that I didn’t think about it earlier, but it is what it is. I got carried away by the backtest numbers without considering whether things can be different if volatility increase. I ignored the long tail of risk of things I don’t see in the backtest.
To fix it, I moved to risking a fixed amount of dollars per trade, instead of fixating on the position size itself.
So, for every trade:
Shares Amount = $ risk / (stop loss - entry price)But There was one More Problem
As fate would have it, I happened to deal with one more sizing problem at the same time. I was taking the same size per trade on two different strategies, even though their volatility was completely different.
This is best understood by looking at the following visualization:
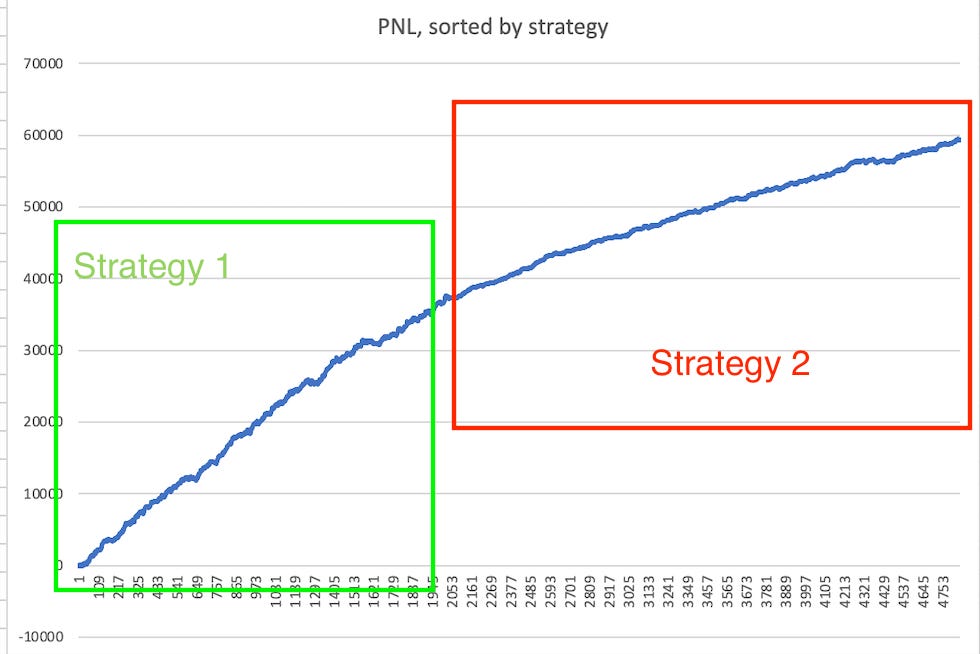
You can clearly see the change in the slopes. It turned out Strategy 1 was always over-represented in my trading.
I only noticed it when for a period of time only Strategy 2 triggered while Strategy 1 had no trades.
It made it very difficult to make any profit and recover from the JNVR loss.
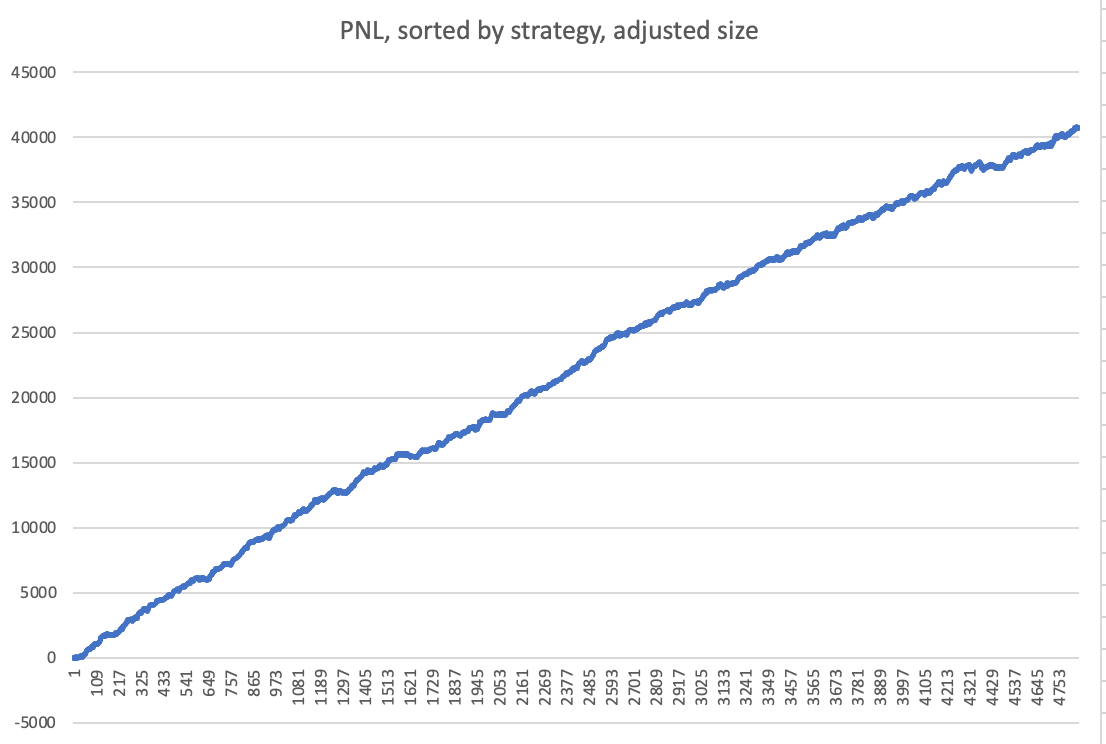
To fix it, I used volatility targeting, reducing Strategy 1's size to a point where the PNL curve is smoother and contributes equally alongside Strategy 2.
Volatility targeting – scaling each strategy to target the same volatility level, effectively smoothing out differences in the PNL curve slope.
Here’s how it looks after adjusting the size:
Conclusion
It’s important to spend time on your sizing logic.
You can have great a setups, but if your risk is all over the place, your PNL curve will be too.
That $9,250 loss on JNVR was painful, but it forced me to confront the hidden flaws in my approach: fixed position sizes and mismatched strategy weights.
Since making the changes—risking a fixed dollar amount per trade and using volatility targeting between strategies—my trading has felt more stable and much easier to stick with psychologically.
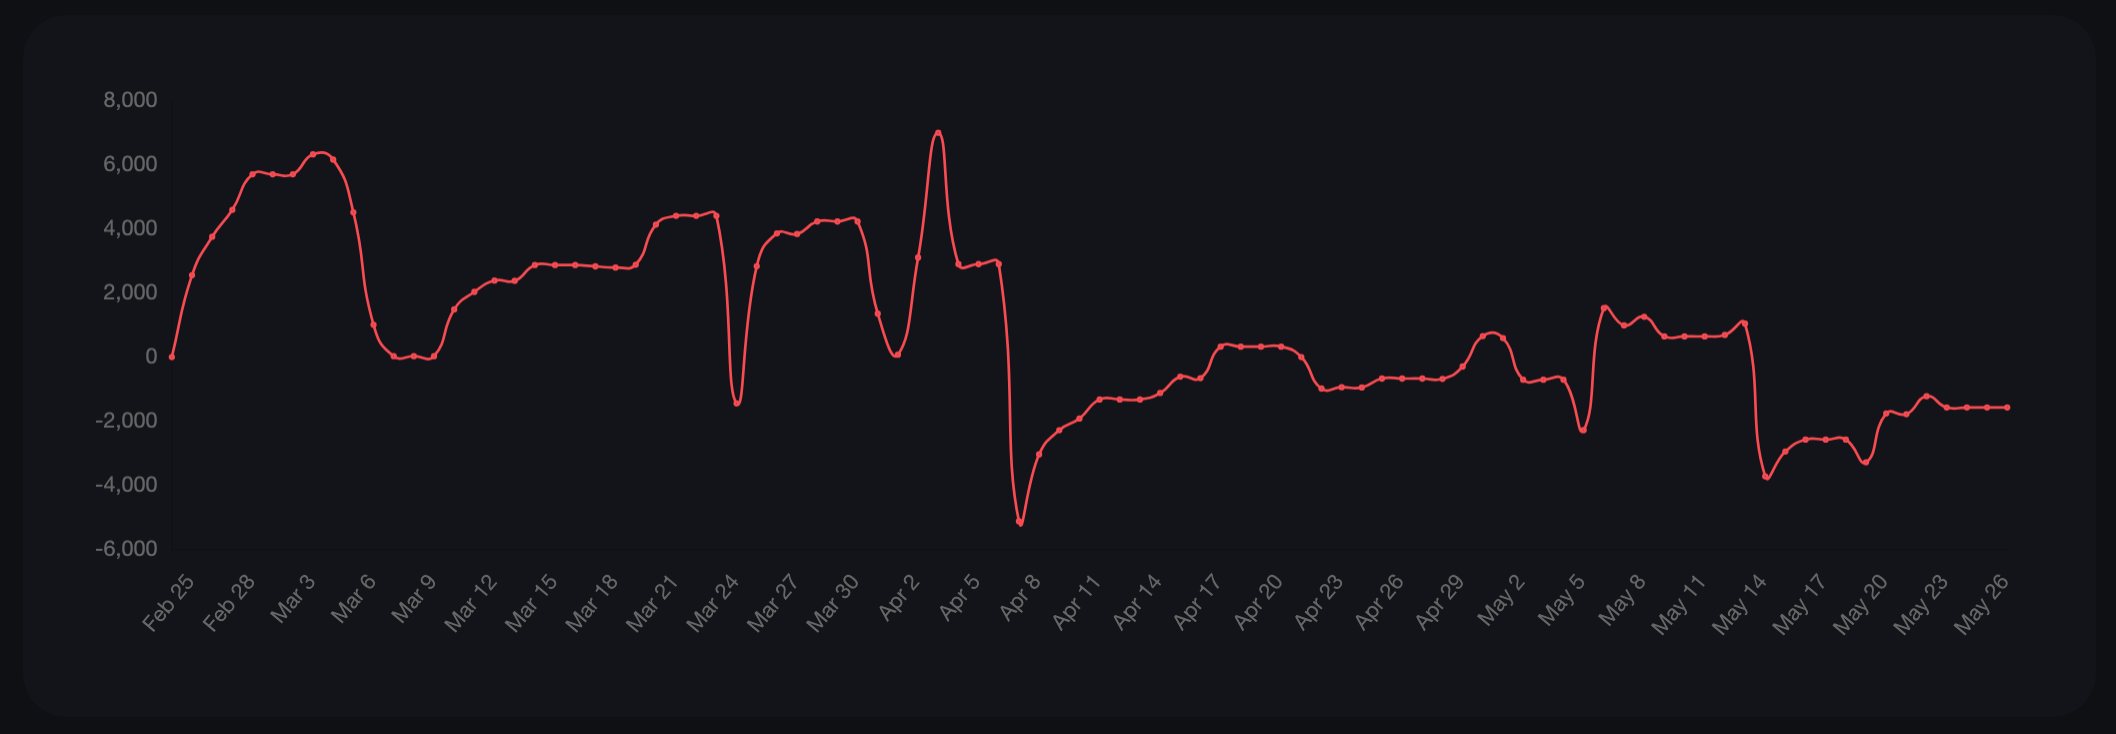
Now only thing left is to get out of this 3 months consolidation in my PNL curve.
Great post! Would you consider share more about Volatility targeting?
Thanks Niv, great post as always !