
The Science of Shorting: Using Backtesting to Find Small-Cap Strategies

After covering why I short small caps last week, this time I’ll share how I short them.
I started shorting small caps around 2019, just before COVID.
At first I followed so-called big traders on Twitter.
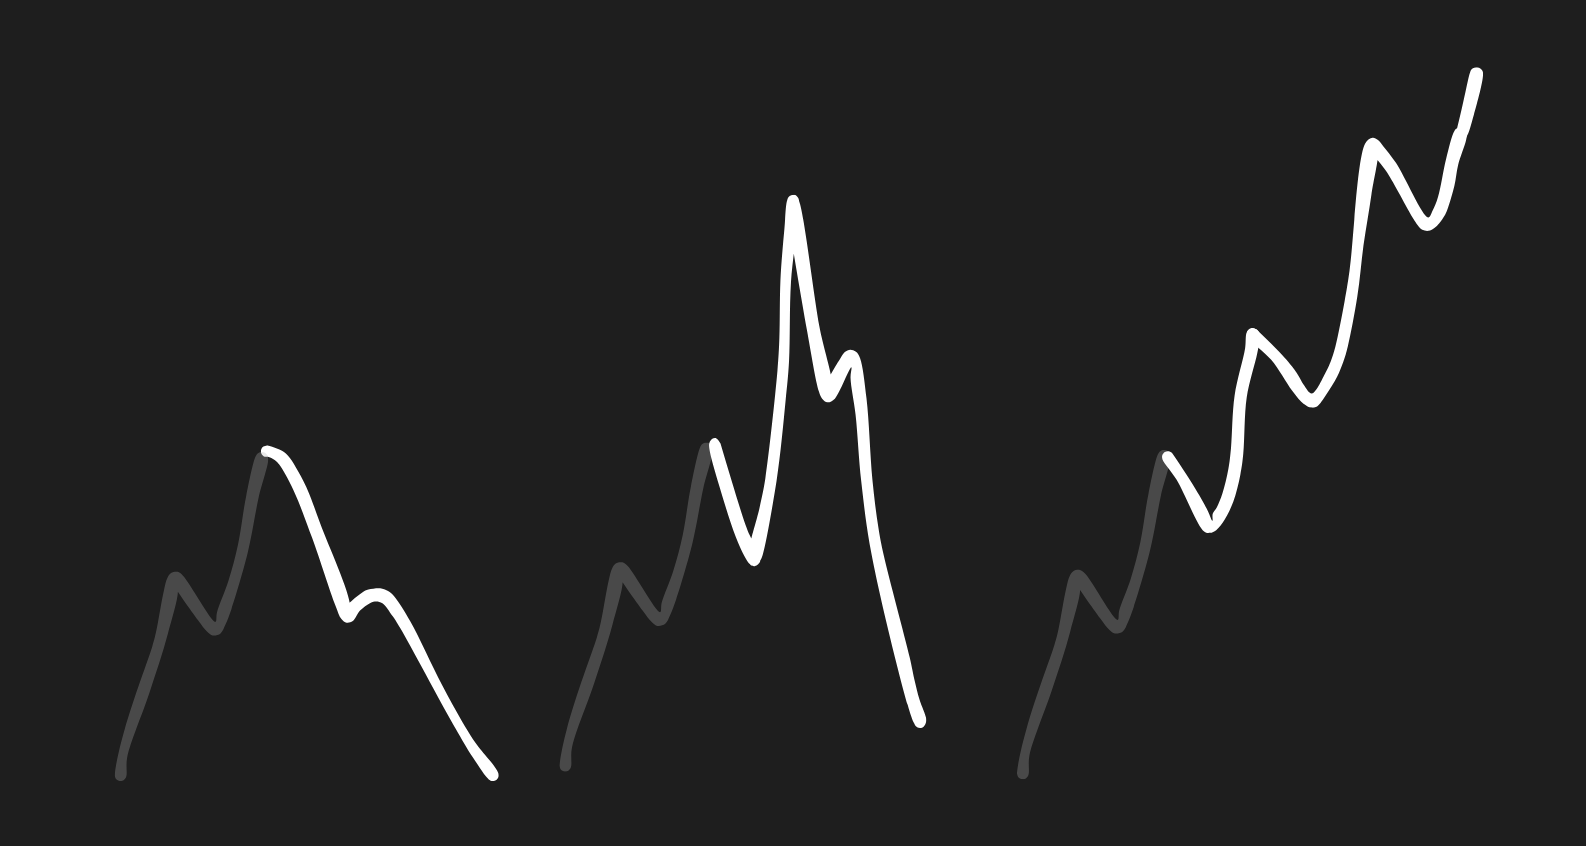
The ones with charts that looked like Christmas trees:
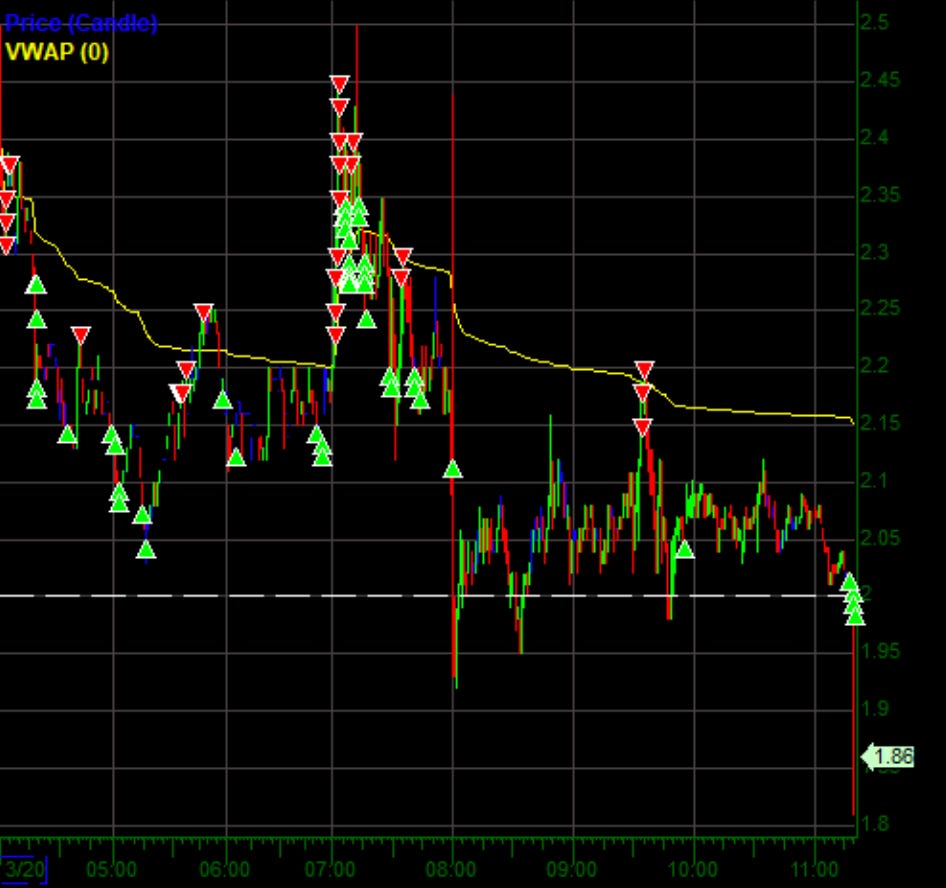
Their $100K days inspired me and I was determined to reverse-engineer their “edge.”
Every time a stock went up what seemed like “too much”, I stacked limit orders trying to catch the top.
When it flushed, I covered.
It worked well—until it didn’t.
Every once in a while, a stock didn’t care that it was up too much.
It kept going way way higher.
And just like that, all my small gains—and then some—were gone.
On those outlier days, the big Twitter traders somehow always managed to avoid the stock, keeping their streak of never-ending wins intact.
“Didn’t you see the float?”
”Next time watch the vwap soaker in the tape!”
There was always a great hindsight reason for the avoid, and I just needed to STUDY it.
I started doubting the method, wanted to get a proof that what I do actually works.
I started to think - what if there’s a way to check if the methods I follow actually works?
Then I Found Backtesting
Using my basic Python skills, I built a backtesting tool to answer this question.
Now, I could see exactly what would happen if I followed specific rules with predetermined entries and exits.
Later, Spikeet was introduced, making the research process much easier.
My Process for Finding an Edge in Small Caps
With all strategies, I want to first see that a very simple strategy has an edge.
Many systematic strategies just buy the open and cover at the close, and that’s a good starting point here as well.
The base case involved tracking all stocks that gapped up more than X%.
I also wanted to filter out untradable instances with low pre-market volume.
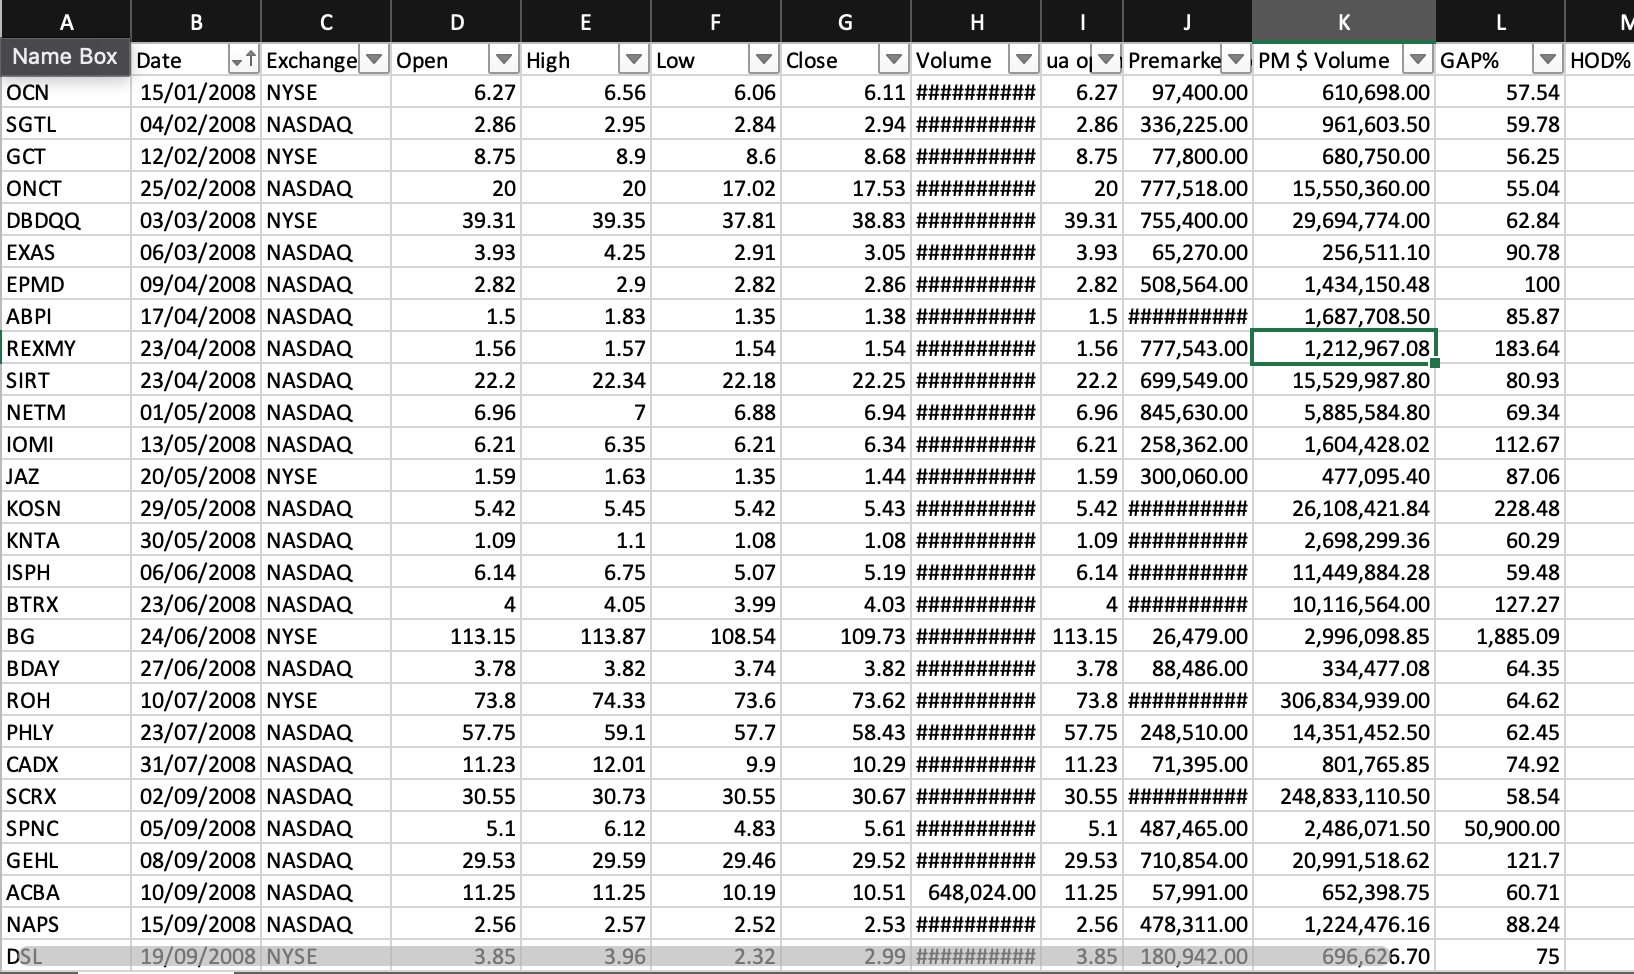
So, I requested from Spikeet all gaps greater than 50% with pre-market volume over $200K since 2008. I downloaded 3,636 instances that met the criteria into an Excel sheet, ready to run a no-code backtest.
Next Step: Backtesting a Simple Strategy
The next step is to backtest a very simple strategy—short the open on every gap up and cover at the close.
Set a wide stop loss. That’s it.
I won’t reveal the stop loss I use, but you can experiment with it to find a satisfying result.
So, I created five new columns:
Stop Loss = Daily open * [(stop loss % / 100) + 1]
Fee = Entry + exit fees based on your broker
Borrow Fees = Based on nine months of data, my average borrow fee is $0.01 per share, so that’s what I use
Shares Amount = I use 5% of my portfolio per trade with a simulated $10K account, calculated as:
0.05 ∗ 10,000 / unadjusted daily open
For each instance, I check:
If today’s high > Stop Loss: Exit at the stop loss price + slippage
Else: Cover at the close of the day
Here’s how the formula looks in Excel:
=IF(E2>=T2,U2*(D2-T2)-R2-S2-0.02*T2,U2*(D2-G2)-R2-S2-0.01*G2)-0.01*D2Where:
E2 = high of day
T2 = stop loss
U2 = shares amount
D2 = day’s open
R2 = borrow fees
S2 = trading fees
G2 = close of day
0.02 * T2 = stop loss slippage
0.01 * D2 = entry slippage
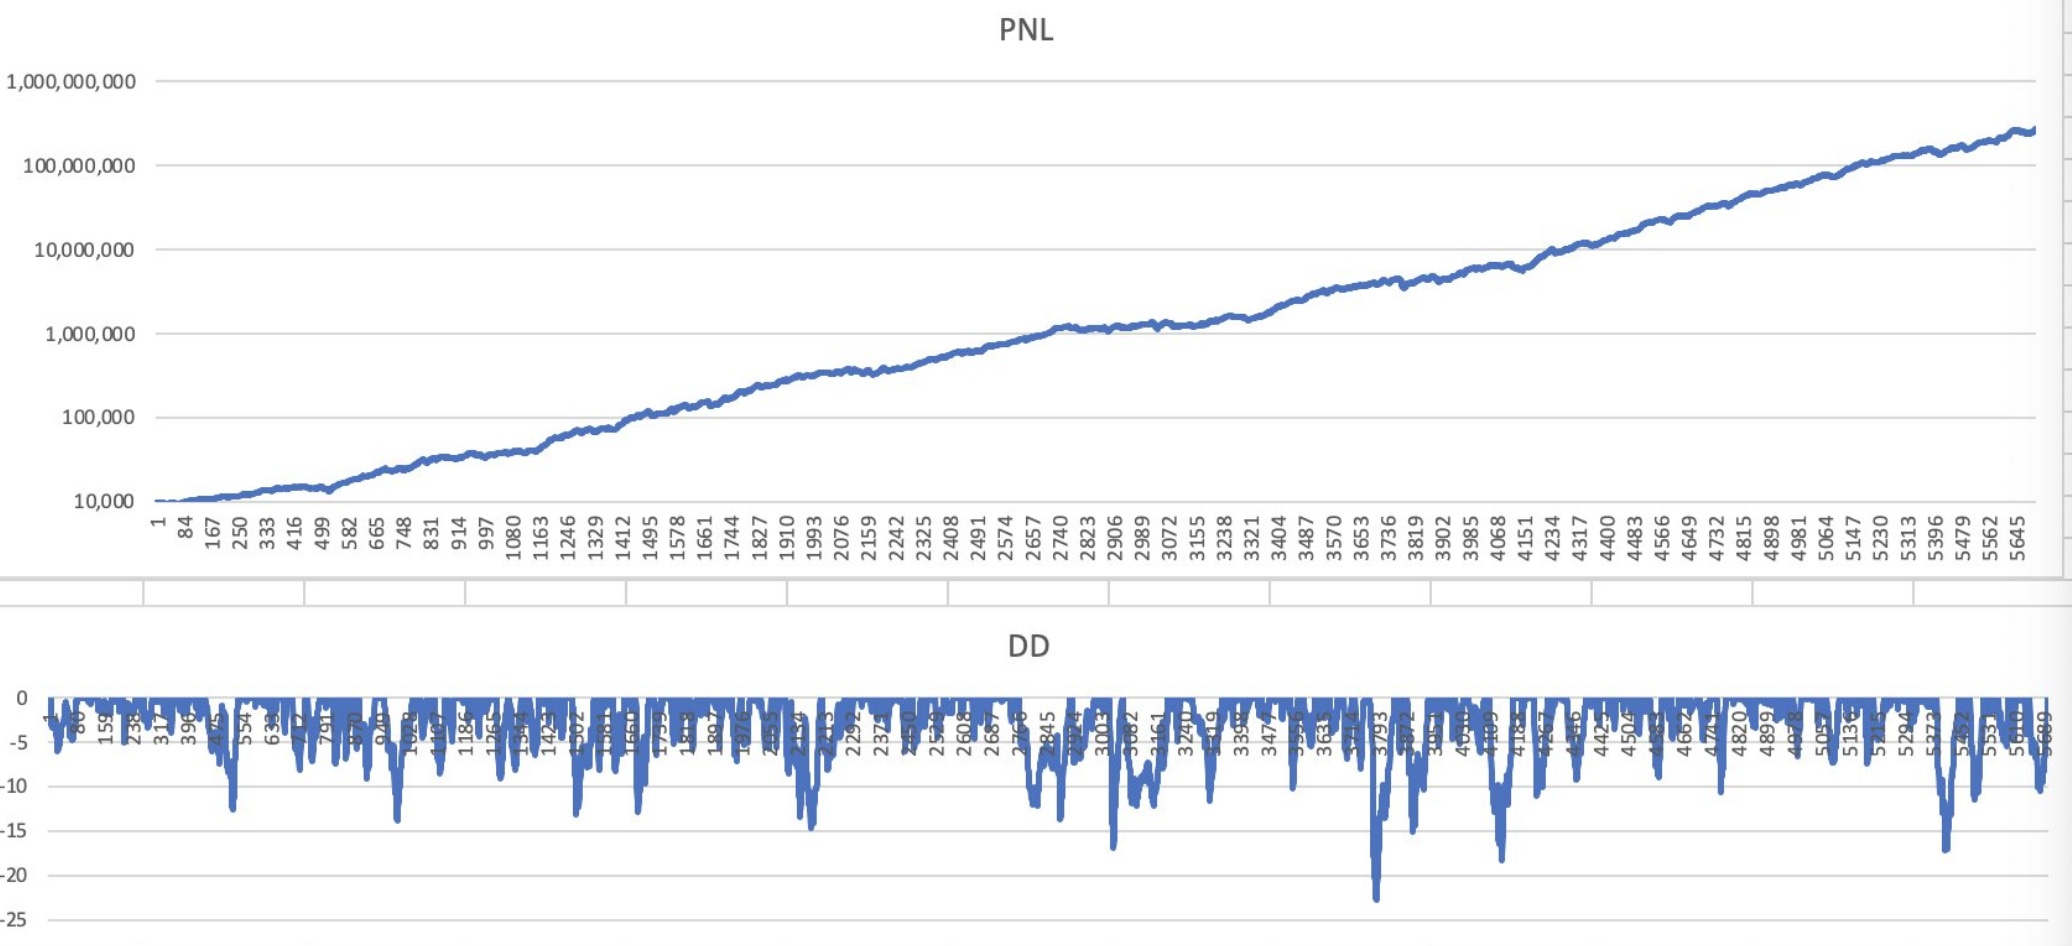
0.01 * G2 = exit slippageHere is the PNL curve for shorting the open — also known as the Opening Print Boys (OPB) strategy:
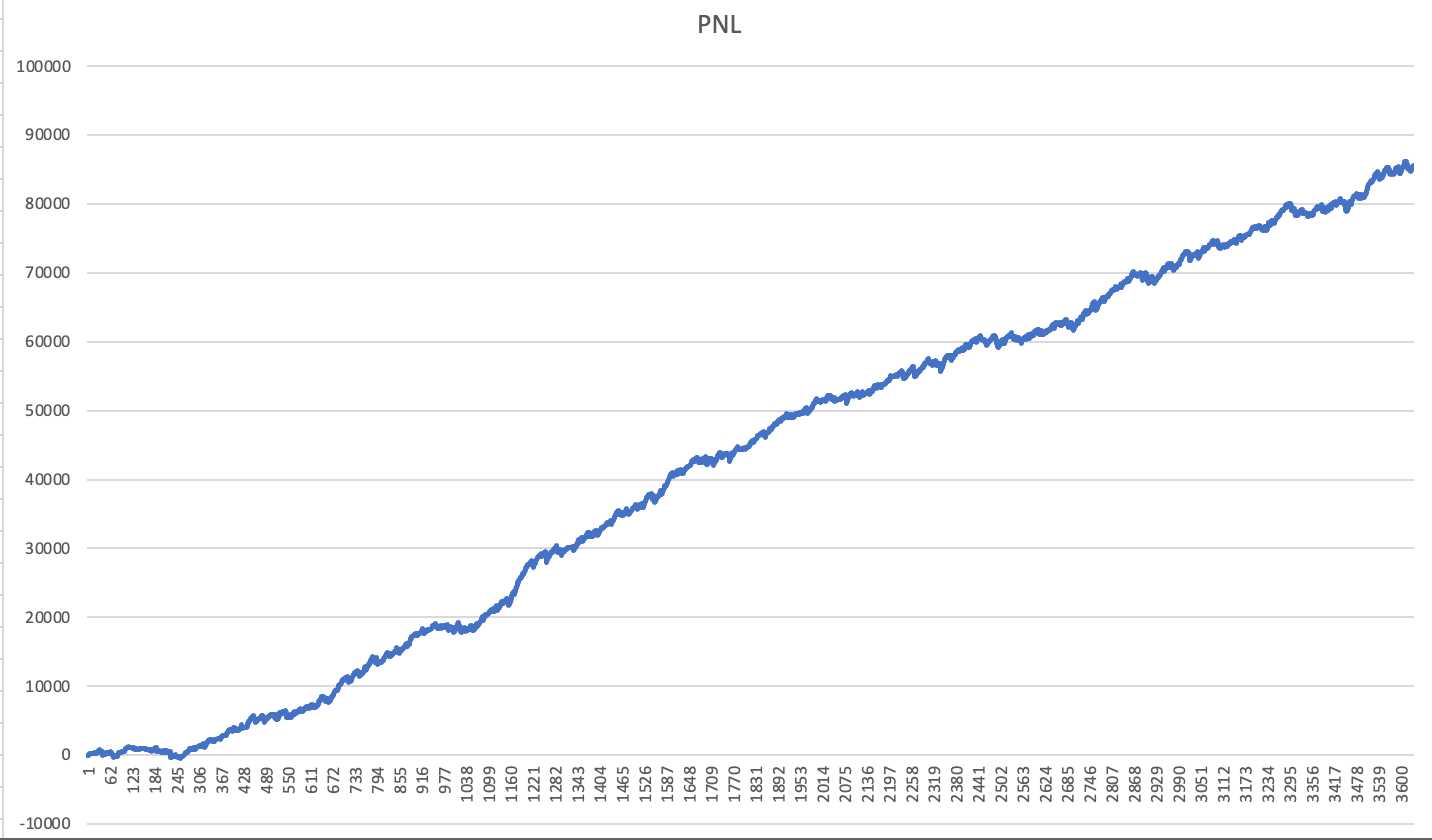
So, the base case is working. It’s not the best strategy, and I don’t use it as-is—but it works.
Another interesting test is to randomly short at some point during the day with a wide stop.
Surprisingly, it works:
This was a real eye-opener for me.
If shorting the open, or even randomly gambling during the day was making money, how could I justify losing money?
Sharpening the Edge
After seeing how OPB works, I improved it with normalization.
Essentially I want as much parameters I use as possible to be normalized.
You can read more about it here.
Once I had a basic strategy with positive expectancy, I could trade it while observing the market every day.
From there, I noticed 3 distinct scenarios in small-cap gappers.
I wanted my strategy to account for all of them to create a smoother P&L curve.
Some stocks will fade right from the open.
For those, I use an improved version of OPB.
A simple, optimized version based on two parameters.
Some stocks will squeeze—some just a little, some a lot.
To handle this, I created three additional signals, each addressing this scenario in a different way.
Then, some stocks will keep running up until the close.
For those, I rely on a stop loss.
The goal is for the small gains generated by my 4 signal system to outweigh the outlier losses from the third scenario.
The 4 signal system has more complex rules than simply shorting the open—but it’s still very straightforward.
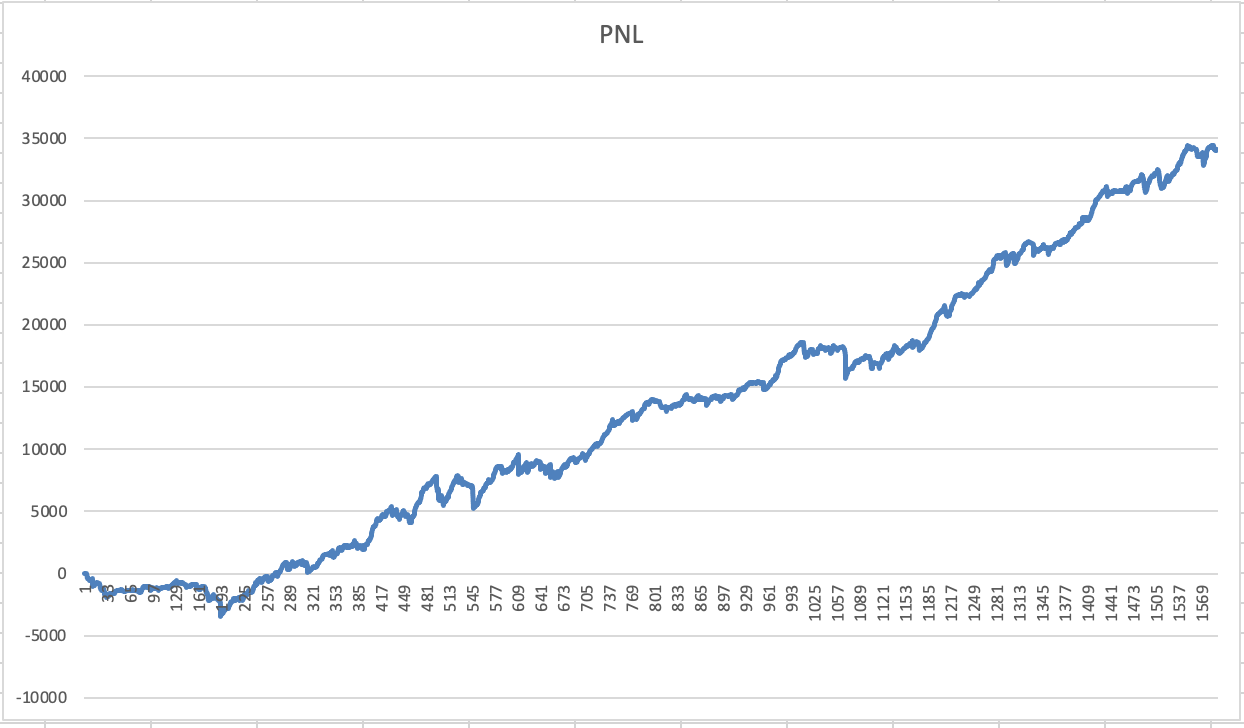
To test it, I run my backtesting engine using data from Polygon.
Here’s what the results look like:
But of course, backtest curves are cheap.
The real goal is to align backtesting results with live trades and adjust backtesting assumptions when discrepancies arise.
This saves both time and money.
By rigorously comparing backtests with live trades every day, I uncovered several mistakes—such as unintentionally looking into the future and miscalculating trading costs.
That’s it for this week, hopefully it will inspire you to find your own edge.
P.S. Many traders I know don’t like OPB. If you’re shorting small caps, are you using OPB? If not, why?
This is another awesome post! Thank you for sharing your insights and expertise, am so grateful. I have had a go at recreating what you have shared, and I experimented with the parameters. I settled on 70% gap up and a SL of 30%, which gives a decent enough looking equity curve, (can't past chart here unfortunately), but not as good as yours. I think the SL is the problem. I tried 2 x ATR and fixed $ but still not as good as yours. Any pointers which will help me in the right direction? Thanks very much
Sometimes, small caps are difficult to short. Did you try the approach with eg. S&P 500 stocks? Would be very interesting to hear your thoughts.