


There Are Only 2 Trading Strategies in the World
Trade against the trend or ride it

Jason Shapiro averaged 34% annual returns by going against the trend.
Richard Dennis, on the other hand, taught a group of traders to ride the trend, earning $175 million in five years.
These two legendary traders represent the only two types of strategies that exist.
Once I understood this, finding strategies became much easier.
No matter what anyone tells you, all directional strategies (those betting on an asset rising or falling) fall into one of these two categories: Mean Reversion or Trend Following.
Each strategy has its own risk and return profile.
So, what are these two strategies, and how do you make money with them?
The Wizard Who Hates Following the Crowd
Jason Shapiro, from the Market Wizards book series, has been achieving an average annual return of 34% for years.
He analyzes Commitment of Traders (COT) data to find extreme points where "too many speculators are long" or "too many speculators are short."
When this happens with a news event that fails to follow through, he takes the opposite position and waits for the number of speculators to revert to the mean.
Shapiro’s method is a Mean Reversion strategy.
In his case, he doesn't focus on price to identify extremes, but he fades the COT data and the news failure.
Most mean reversion strategies, however, focus on price.
Buy Low, Sell High
In a Mean Reversion strategy, you buy an asset that has dropped significantly, expecting it to return to its "fair price."
Alternatively, you short an asset that has surged, expecting a correction (though this is trickier due to borrowing requirements and unlimited risk).
Mean Reversion strategies typically have very high success rates but low risk-to-reward ratios.
Positions are held for a relatively short time, and stop-losses are often just a guideline.
After all, if you buy an asset because it's fallen, a further drop makes the opportunity even better, right?
So, how do you manage risk?
Position Size Is the Stop-Loss
Exits in this strategy are usually behavior-based, such as "sell after the first green candle" or "exit after a 5% upward correction."
But what if the asset continues to drop all the way to 0?
In that case, you lose only the size of your position—say 1% of your account.
When trading larger assets like indexes (e.g., SPY), the risk of the asset going to zero is virtually non-existent.
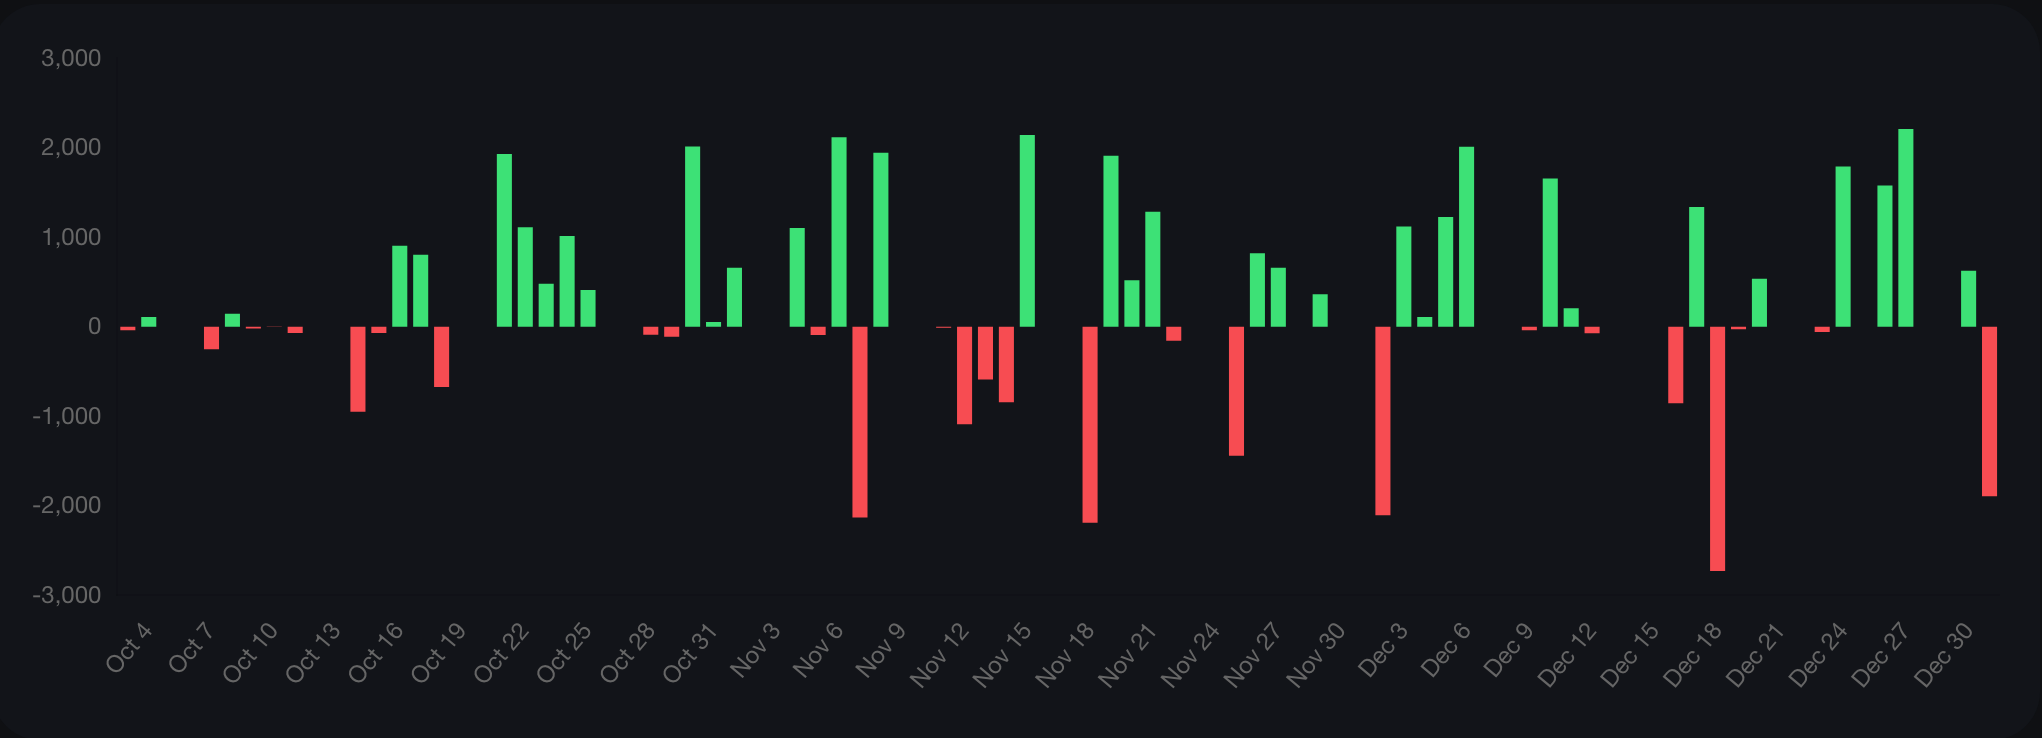
Returns Profile of Mean Reversion
This strategy produces many small profits and a few large losses.
If this matches your profit distribution, you're likely using a Mean Reversion strategy.
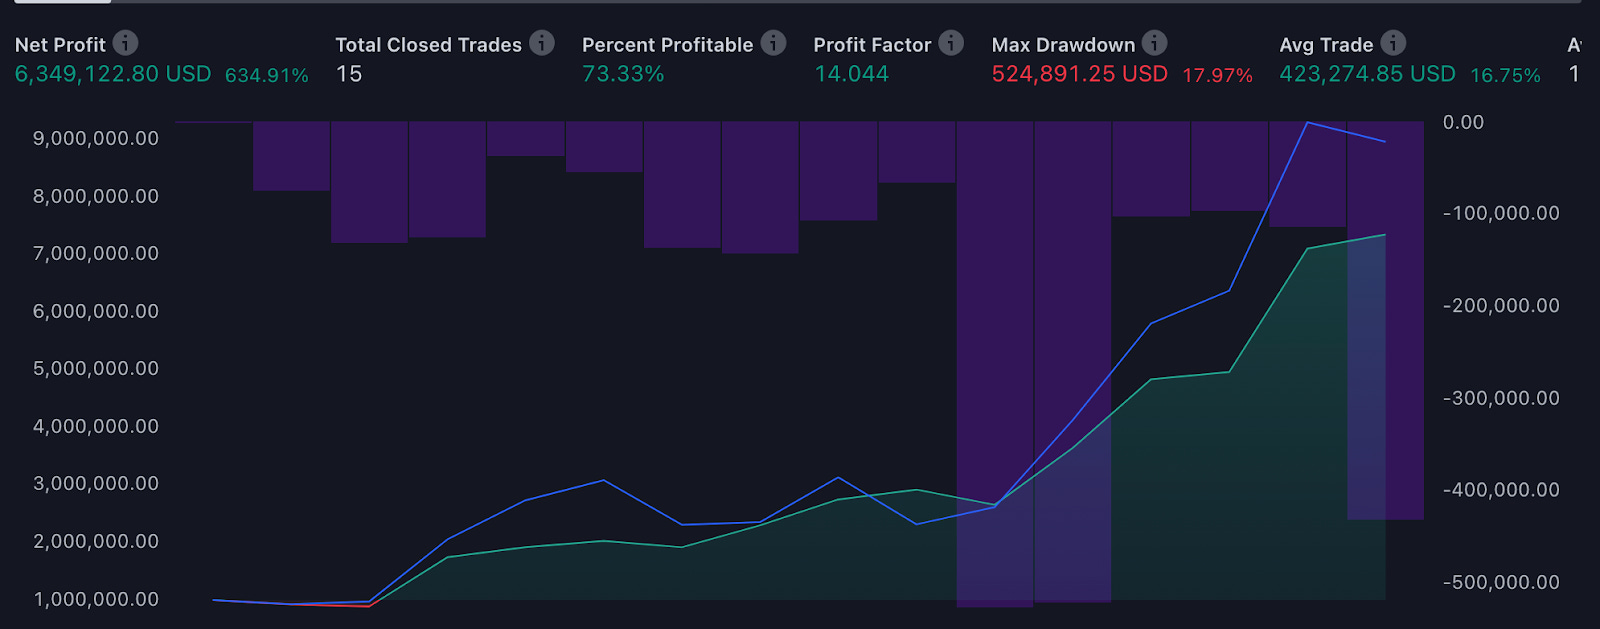
Here is my short small caps returns for the past 3 months, that fits the mean reversion type of returns distribution:
Edge Leak 1 : Profiting from Others' Panic
The Money Flow Index (MFI) is a popular indicator for mean reversion strategies.
Since SPY trends upward in the long term, you can buy every dip expecting it to recover.
Here are the rules:
When the MFI(2) of the previous candle hits 0, buy at the next open.
Sell when the close exceeds the previous high or after 9 days.
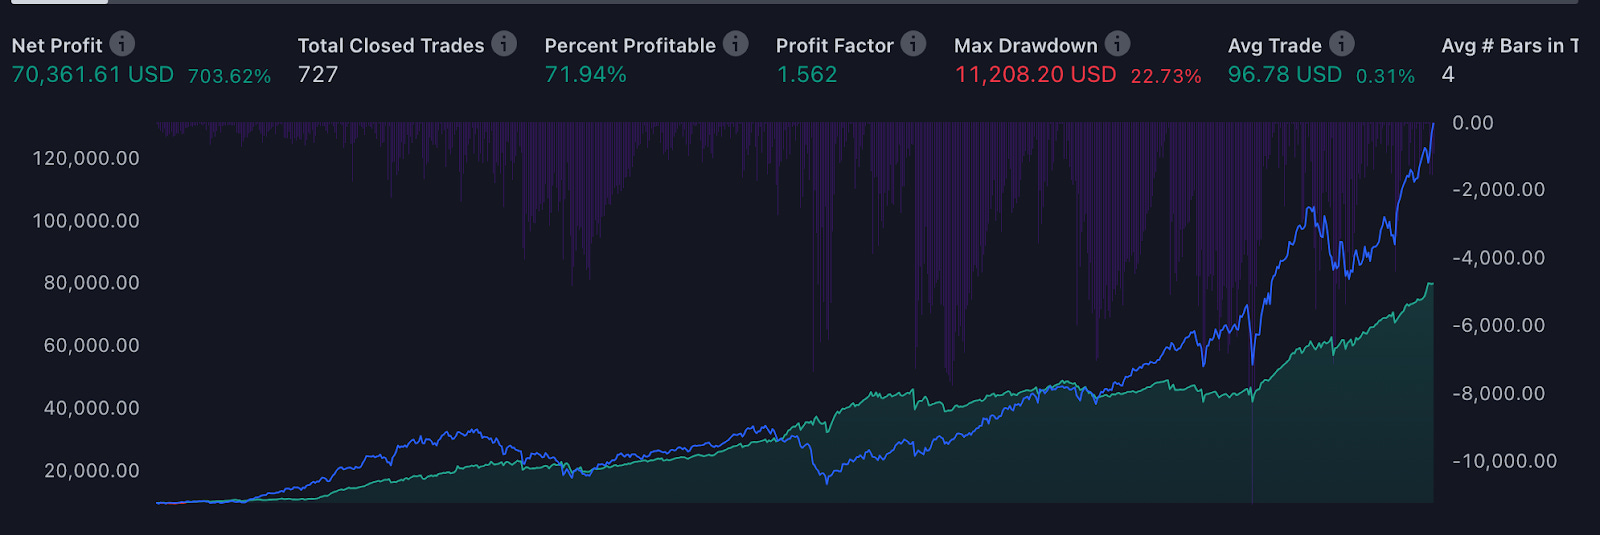
This strategy has no stop-loss and holds positions for a maximum of 9 days.
It has a 72% win rate with a risk-to-reward ratio of 0.6 (for every dollar lost, it gains 60 cents).
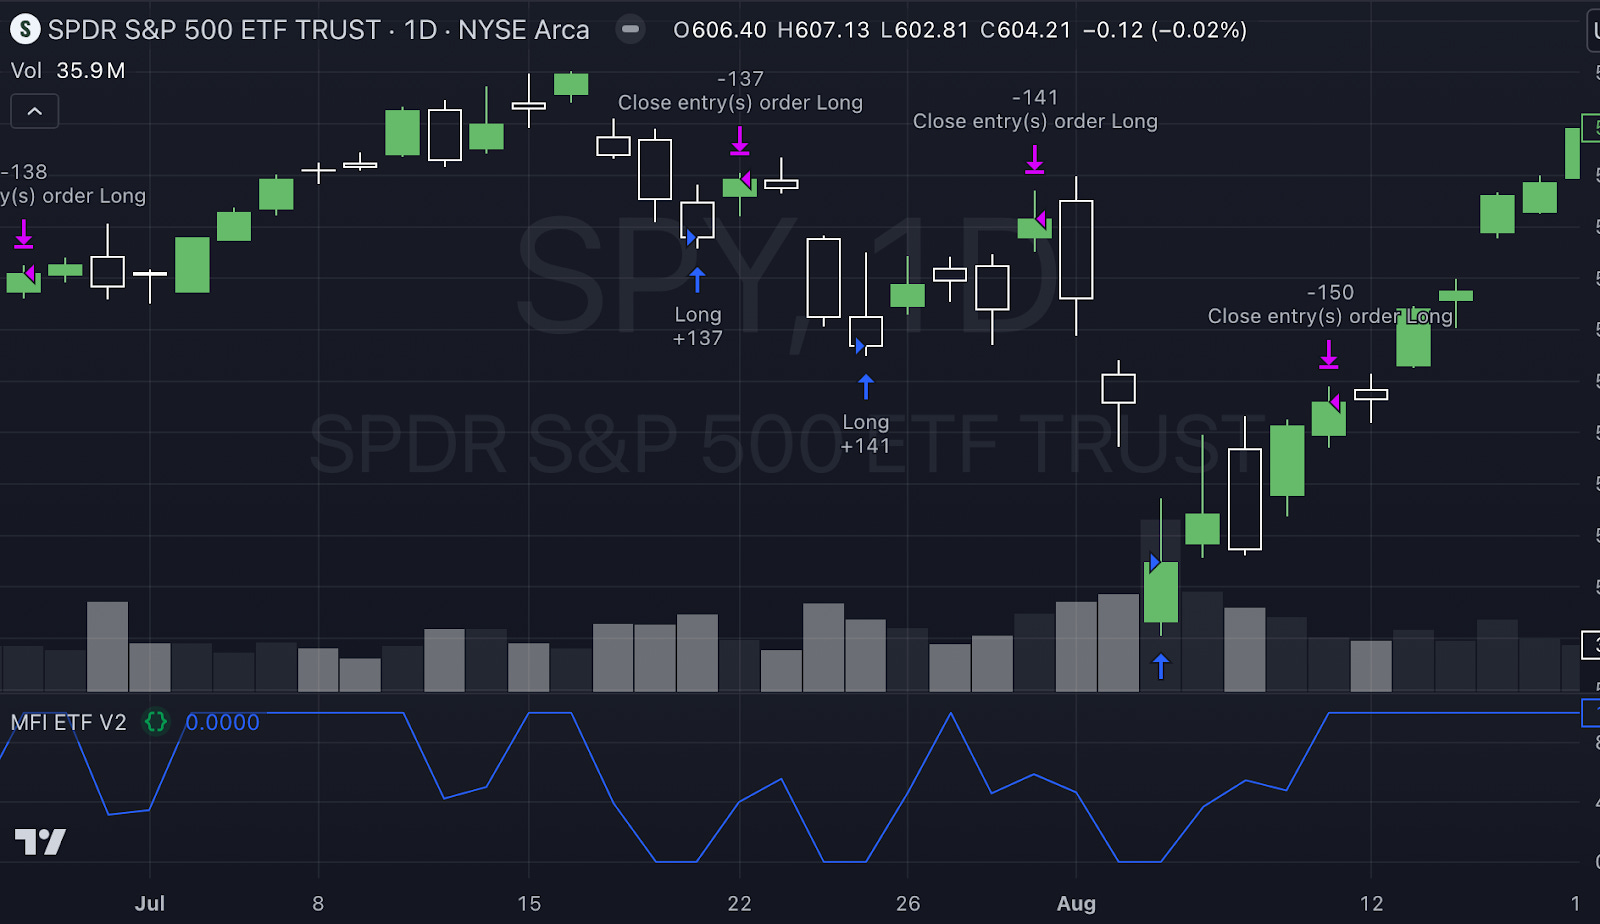
Trade examples:
But sometimes, we exit a mean reversion trade just to see the asset goes a long way without us.
To get exposure to outlier uptrends, we use trend following strategies..
The $175 Million Experiment
Richard Dennis believed that anyone could be taught a profitable trading system.
William Eckhardt disagreed, so they conducted an experiment.
They gathered 21 men and women, taught them Dennis's strategy, and gave them money to trade.
The strategy was simple:
Buy when the price closes above the high of the past 20 days.
Sell when the price closes below the low of the past 20 days.
This trend following strategy allows you to ride trends as long as they persist.
Over five years, the "Turtles," as they were called, made $175 million.
Many of them still trade today, managing successful hedge funds with slight variations on the strategy.
Trend Following: Buy High, Sell Higher
Dennis's approach was a classic trend following strategy.
Here, you buy an asset that has risen significantly, expecting it to continue rising.
Trend following strategies usually have low success rates but high risk-to-reward ratios (many small losses and a few massive wins).
Positions are held for a long time, and stop-losses protect against reversals.
Since only a small number of trades account for the bulk of the profits, it's crucial to take every trade and avoid taking profits too early.
The real returns come from riding trends as long as possible, exiting only when the trend clearly reverses.
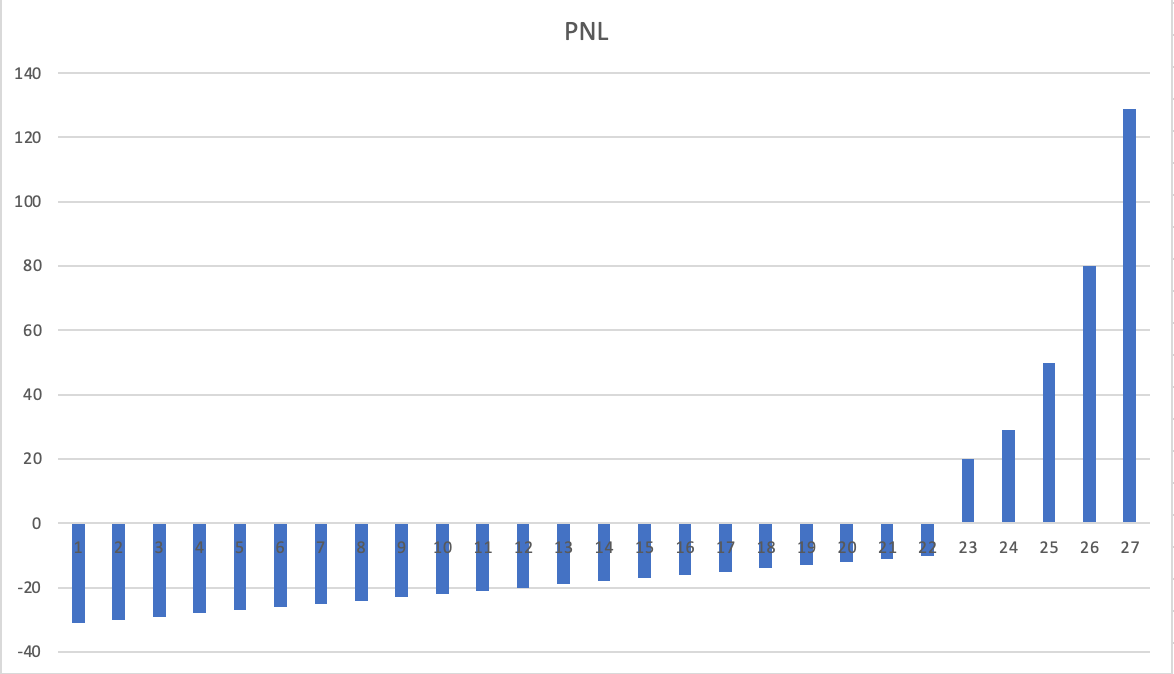
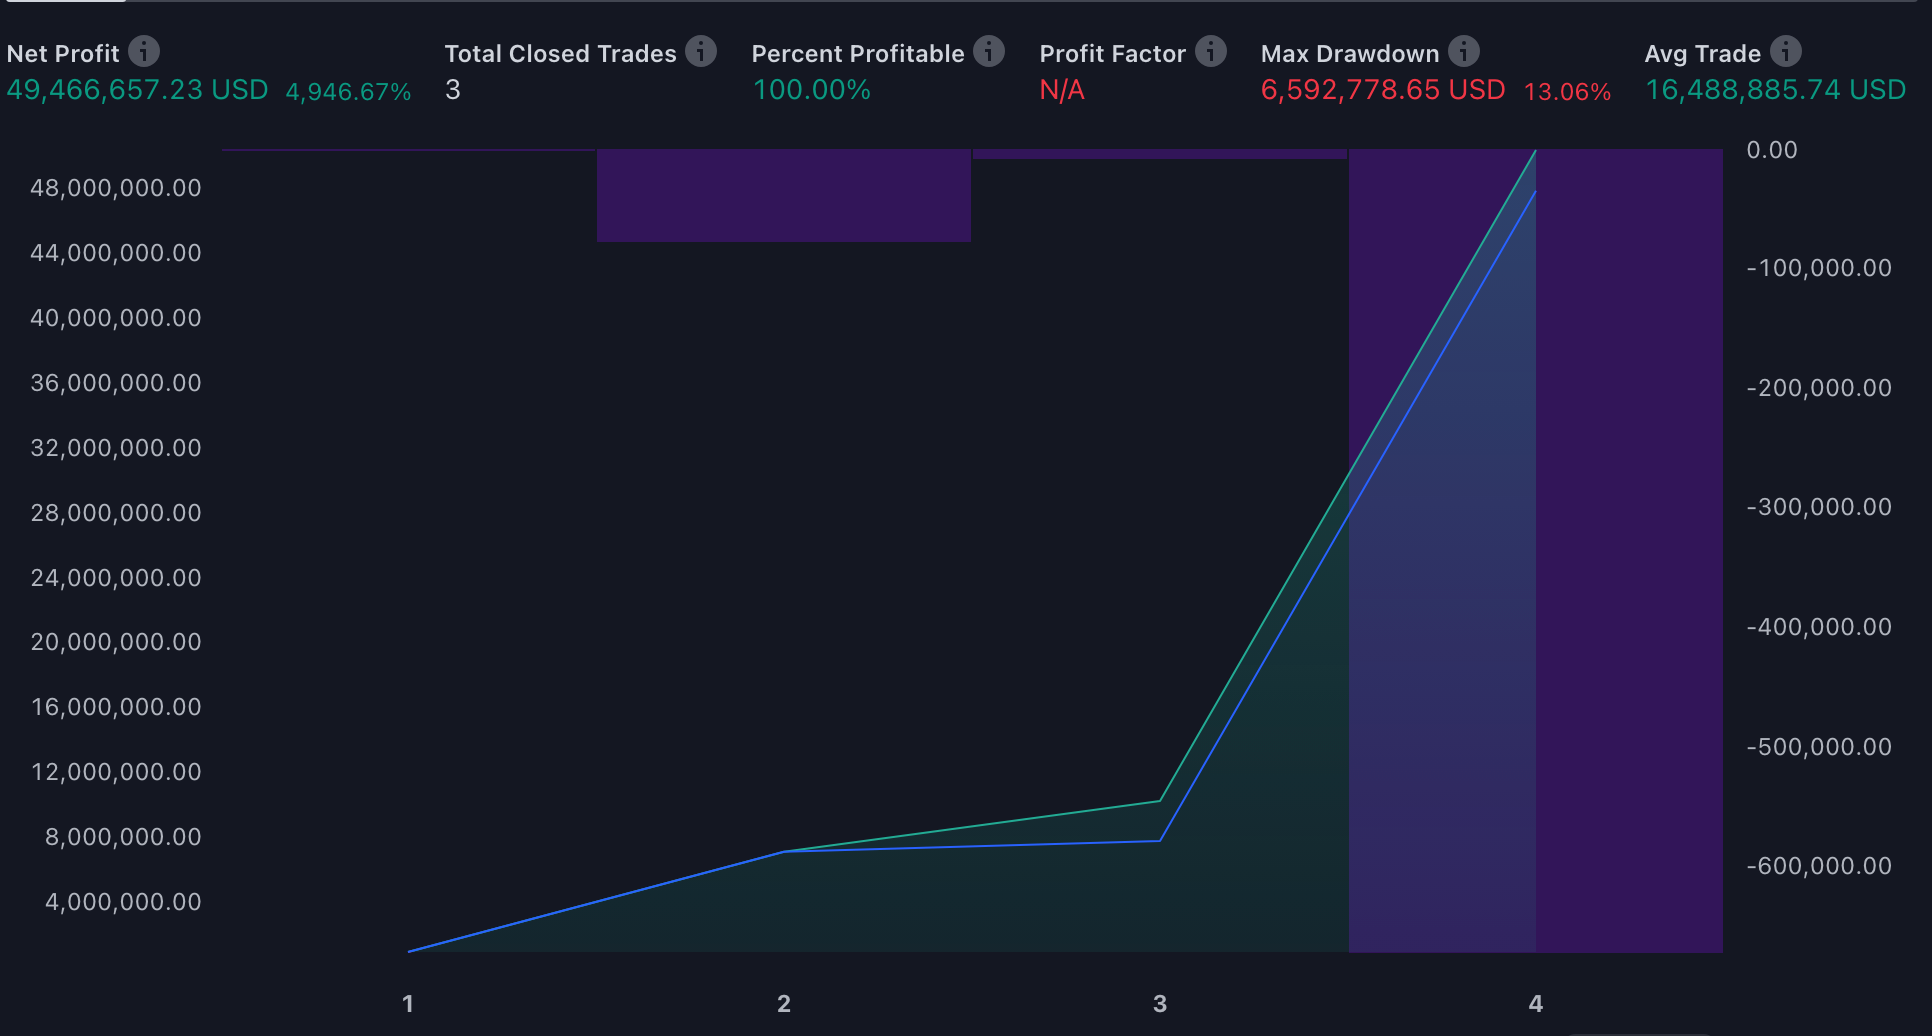
Returns Curve of Trend Following
This strategy has many small losses and a few large gains.
If this matches your profit distribution, you're likely using a trend following strategy.
Edge Leak 2: A Simple, Profitable Trend Following Example
Using only a 10-period moving average, you can create a profitable SPY strategy.
Here are the rules:
Buy when the monthly candle closes above the 10-period moving average.
Sell when the monthly candle closes below the 10-period moving average.
If you had followed this strategy since 1963, these would have been the results:
I used this strategy to ride Bitcoin since 2017:
Combining the Two: The Best of Both Worlds
At certain times, trend following strategies perform better, while at others, Mean Reversion strategies shine.
Combining both can provide smoother PNL curves and lower drawdowns, protecting both your account and mental health.
Insightful.
i wonder if there's a contrarian indicator (like the MFI = 0) that is proved to be good for longer than previous high / 9 days.
surely the likes of Warren Buffet who sit on a mountain of cash are using something (other than the phone call they get to advise on a rescue to the entire financial sector)
I agree with your post . That is exactly my views and what my posts are all about . Just focusing on a few strategies